The properties are as described in the section called “Common Properties”.
In addition, the following properties are unique to Pie Charts:
Top Count: Indicates the number of largest values to plot. Drag the slider to set the top count.
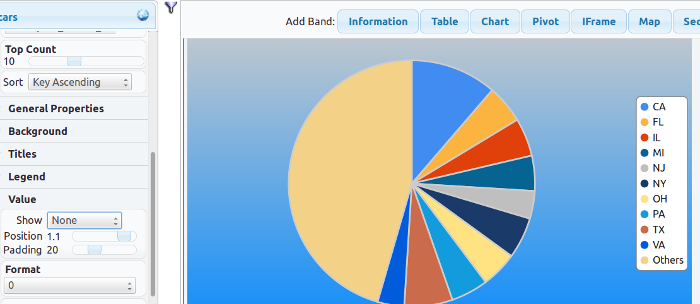
You can display the values on the pie chart in the following formats. Select one from the Value drop down:
- None: Netiher the key nor the value is displayed on the pie chart.
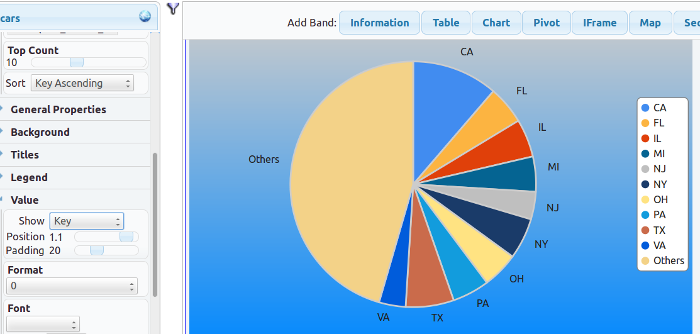
- Key: Displays the Key on the pie chart.
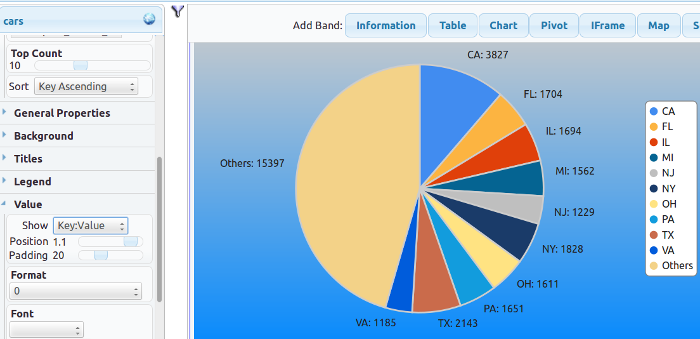
- Key:Value: Displays the Key and the Value on the pie chart.
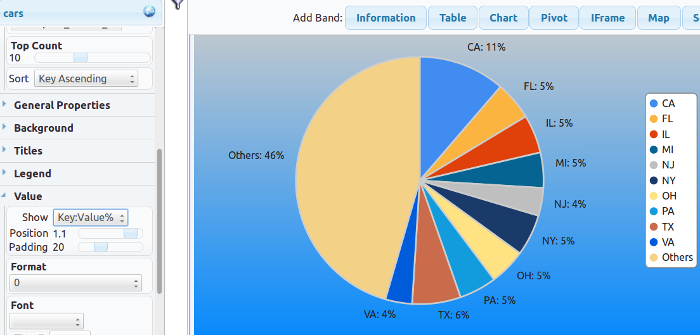
- Key:Value%: Displays the Key and the Value (as a %) on the pie chart. This is especially useful when values such as average are being computed and the value cannot be computed accurately due to rounding errors.
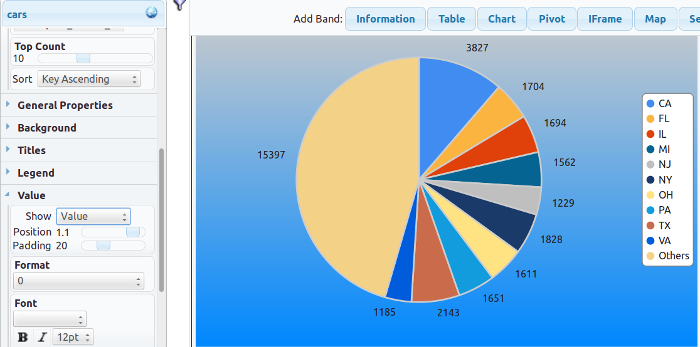
- Value: Displays the Value on the pie chart.
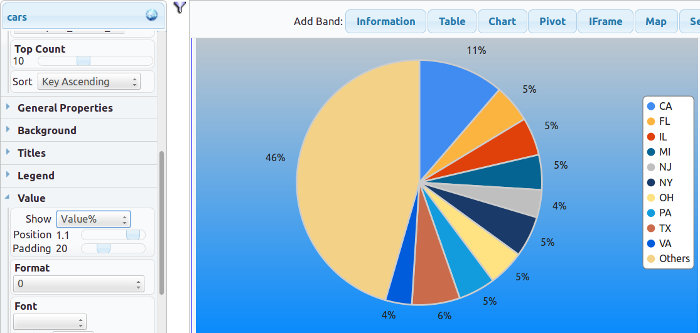
- Value%: Displays the Value (as a %) on the pie chart. This is especially useful when values such as average are being computed and the value cannot be computed accurately due to rounding errors.