
Report Designer
The Report Designer page allows you to create and edit the setup of the report. You need to have the following privileges:
mod-adhoc-reportmod-adhoc-report-edit
Interface
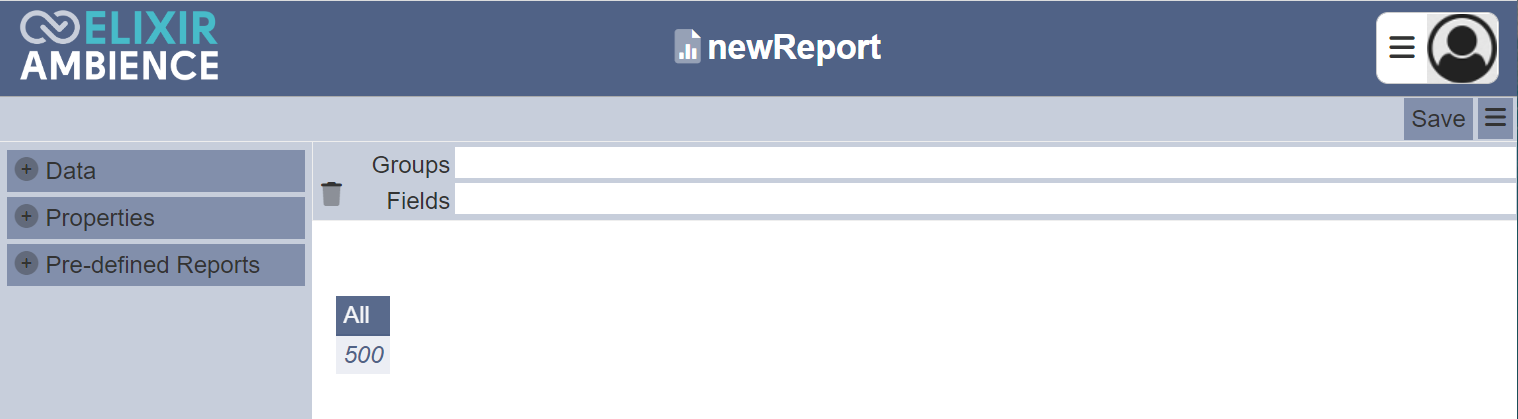
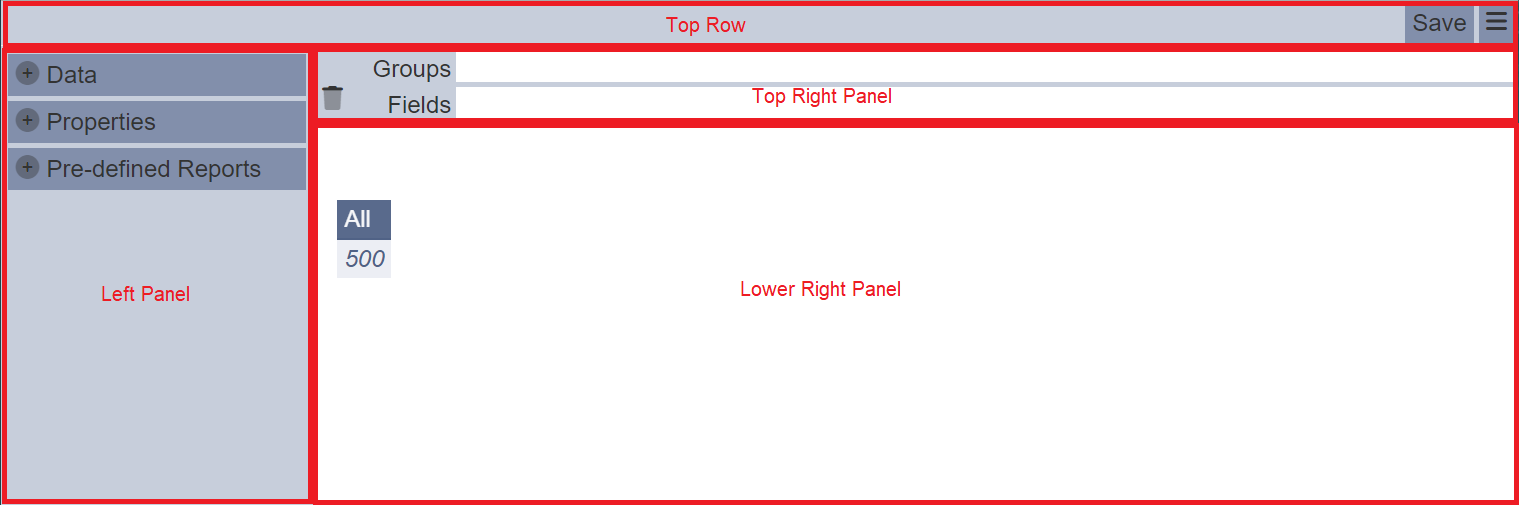
The Report Designer displays no report table by default. It can be divided into four portions:
- Top row - Consists of the “Save” and “More Actions” buttons
- Left panel - Displays data, properties and pre-defined reports
- Top right panel - Displays selected data
- Lower right panel - Displays report
Top Row
The top row consists on the “Save” and “More Actions” buttons.
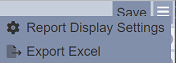
The “Save” button saves the changes made to the report. The  “More Actions” button when clicked displays a list of actions available.
Report Display Settings
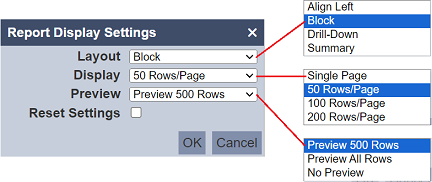
The “Report Display Settings” option allows user to select the display and layout settings of the report.
| Field | Description | Input Type | Default Value |
|---|---|---|---|
| Layout | Selects the layout of the report. Available options: - Align Left - Block - Drill-Down - Summary |
Drop-down list | “Blocks” |
| Display | Selects the number of records to display in a page. Available options: - Single Page - 50 Rows/Page - 100 Rows/Page - 200 Rows/Page |
Drop-down list | “50 Rows/Page” |
| Preview | Selects the number of records for the page. Available options: - Preview 500 Records - Preview All Records - No Preview The thirds option will remove all table in the lower right panel. |
Drop-down list | “Preview 500 Records” |
| Reset Settings | If selected, resets all settings in the report. | Checkbox | Not selected |
The “Preview” field by default selects “Preview 500 Records”. You may select “Preview All Records” if the report is not too big. If “No Preview” is selected, no data will be displayed in the lower right panel. It may be useful to display just 500 records in the lower right panel as some report may be huge. This helps to save processing time.
The “Layout” field by default selects “Block”. The other options will produce different layout.
| Option | Layout |
|---|---|
| Align Left | 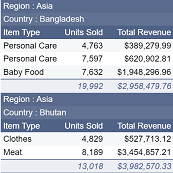 |
| Block | 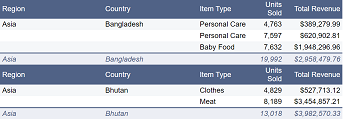 |
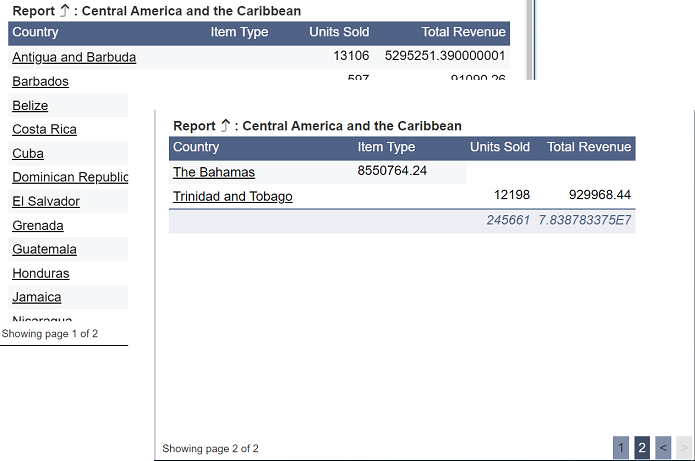
| Drill-Down | 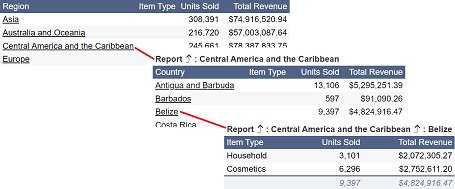 |
| Summary | 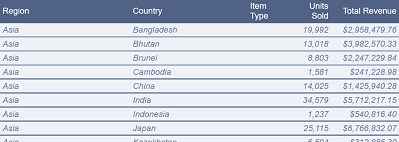 |
The “Display” field by default selects “50 Rows/Page”. This sets the number of records per page. There are other options, such as 100 and 200 rows/page. If the number of records exceeds the “rows per page” value, the page navigator will appear at the bottom right of the report interface and the page information is displayed at the bottom left.
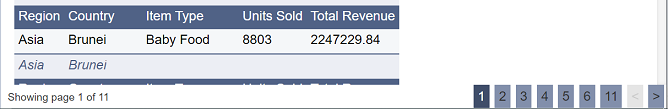
To view the other pages, click  icon to go to the next page or simply click on the page number. To go back to the previous page, click on the
  icon.
icon.
If Drill Down layout is selected, the top row will remain regardless which page it is in.
Export Excel
The “Export Excel” option allows user to export the report to an Excel file. Depending on the current layout of the report, the exported Excel file differs.
Left Panel
The left panel consists of three sections:
- Data - Lists the fields of the dataset and the values of the fields
- Properties - List of title, header and footer for the report
- Pre-defined Reports - List of pre-defined reports
These sections by default are minimised except for the Data section. To access the content, click on the  icon on the left of each section.
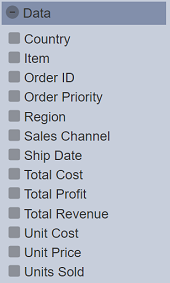
Data
The Data section list the fields from the dataset except those that have the “Show” field unselected in the “Fields” tab in their properties. These fields are not used in the report by drag-and-drop onto the “Groups” and “Fields” in the top right panel.
Properties
The Properties section allows you to define the title of the report, as well as the header and footer.
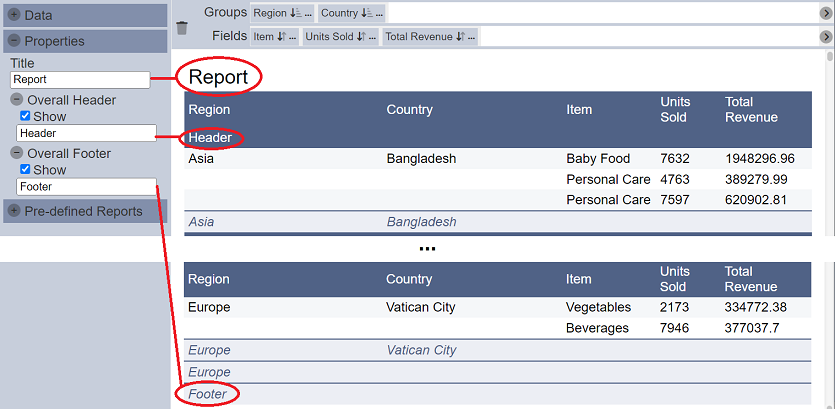
Once the header/footer is added and the “Show” field is selected, the header will appear in the report in the lower right panel.
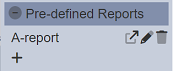
Pre-defined Reports
The Pre0defined Reports section allows you to add report that are as per defined currently. To do so, click on the “+” icon in the section.
A “Add new predefined report” dialog box will appear.
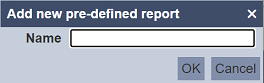
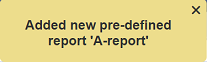
Key in a unique name for the report and click on the “OK” button. A message will appear once the report is added.
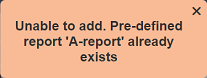
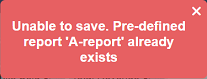
If the name of the report already exist, an error message will appear.
More reports can be added using the same method above.
After the report is added, the new report will appear under the section.
There are three icons on the right of the report, which allows you to apply, edit and delete the report respectively. The  “Apply” icon when clicked applies the properties of the pre-defined report. The
  “Edit” icon when clicked, launches the “Edit pre-defined report” dialog box.
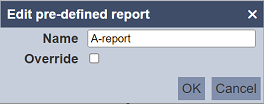
You can edit the name of the report. The name must be unique. If the name already exist, an error message will appear when the “OK” button is clicked.
The “Override” field allows you to override the settings of the pre-defined report with those of the current report. Overriding an existing pre-defined report is not allowed.
To delete a pre-defined report, click on the  “Delete” icon. There is an option to undo the deletion. A notification with an “Undo” button appears right after clicking on the icon.
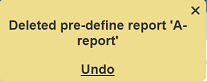
Upon clicking on the “Undo” button, the deleted report is restored and is added back to the list of reports.
Top Right Panel
This panel allows you to set the fields for the view and it consists of two fields:
- Groups - Defines the YAxis of the report table
- Fields - Defines the XAxis of the report table
Add Data
To add data into the fields, click on the “+” icon on the “Data” section in the left panel. The list of fields of the dataset are displayed.
Drag and drop the data to the desired fields (“Groups” or “Fields”).
Once “Groups” and “Fields” fields are populated, the report table will appear in the lower right panel.
You can add more data into the fields by drag and drop the data into the fields. The data will be added to the end of the list. You can re-arrange the data in the fields by dragging and dropping them into their desired place (e.g., from the end of the list to the middle or front or from the “Fields” field to the “Groups” field).
 )
)
Remove Data
To remove a data from the fields, simply drag-and-drop the data to the “Drag Here to Delete” icon on the left of the panel.
Sort Data
The data selected into the “Groups” and “Fields” fields can be sorted and their properties edited.
By default the “Groups” field is sorted in ascending order and the “Fields” field is not sort (i.e., the data is presented as per in the dataset). Hover over the icon to see the current sorting method. There are three different sorting method, namely Ascending, Descending and No Sort.
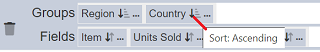
To select a different sorting method, click on the ![]() “Sort” icon until the desired sorting method appears.
“Sort” icon until the desired sorting method appears.
Edit Properties
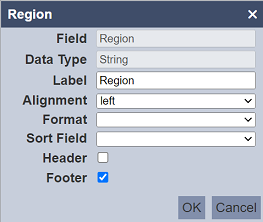
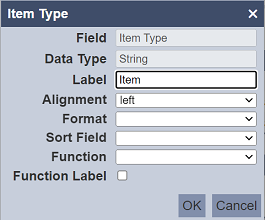
To edit the properties of the data, click on the  “Properties” icon of the desired data. A dialog box will appear. The properties for data in the “Groups” and “Fields” differs. Below shows the dialog box for data in the “Groups” and “Fields” respectively.
| Field | Description | Input Type | Default Value |
|---|---|---|---|
| Field | Original name of field as in dataset. It is not editable. |
Text field | Name of field as in dataset |
| Data Type | Data type of field. It is not editable. |
Text field | Data type as in dataset |
| Label | Label of field in report. By default this field uses the value in “Field”. |
Text field | As per setup |
| Alignment | Defines the alignment of the field. Avialable options: - left - center - right |
Drop-down list | “left” |
| Format | Defines the format of the field. | Drop-down list | Not selected |
| Sort Field | Selects the field in the dataset to sort this field. | Drop-down list | Not selected |
| Groups | |||
| Header | If selected, displays the header of the group. | Checkbox | Not selected |
| Footer | If selected, displays the header of the group. | Checkbox | Selected |
| Fields | |||
| Function | Selects the function to be performed on the field. The value will appear in the footer. Available options: - Blank - Count - Sum - Min - Max - Median The list of options vary according to the data type. |
Drop-down list | Blank |
| Function Label | If selected, displays the name of the function in the footer of the report. | Checkbox | Not selected |
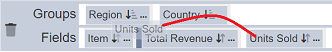
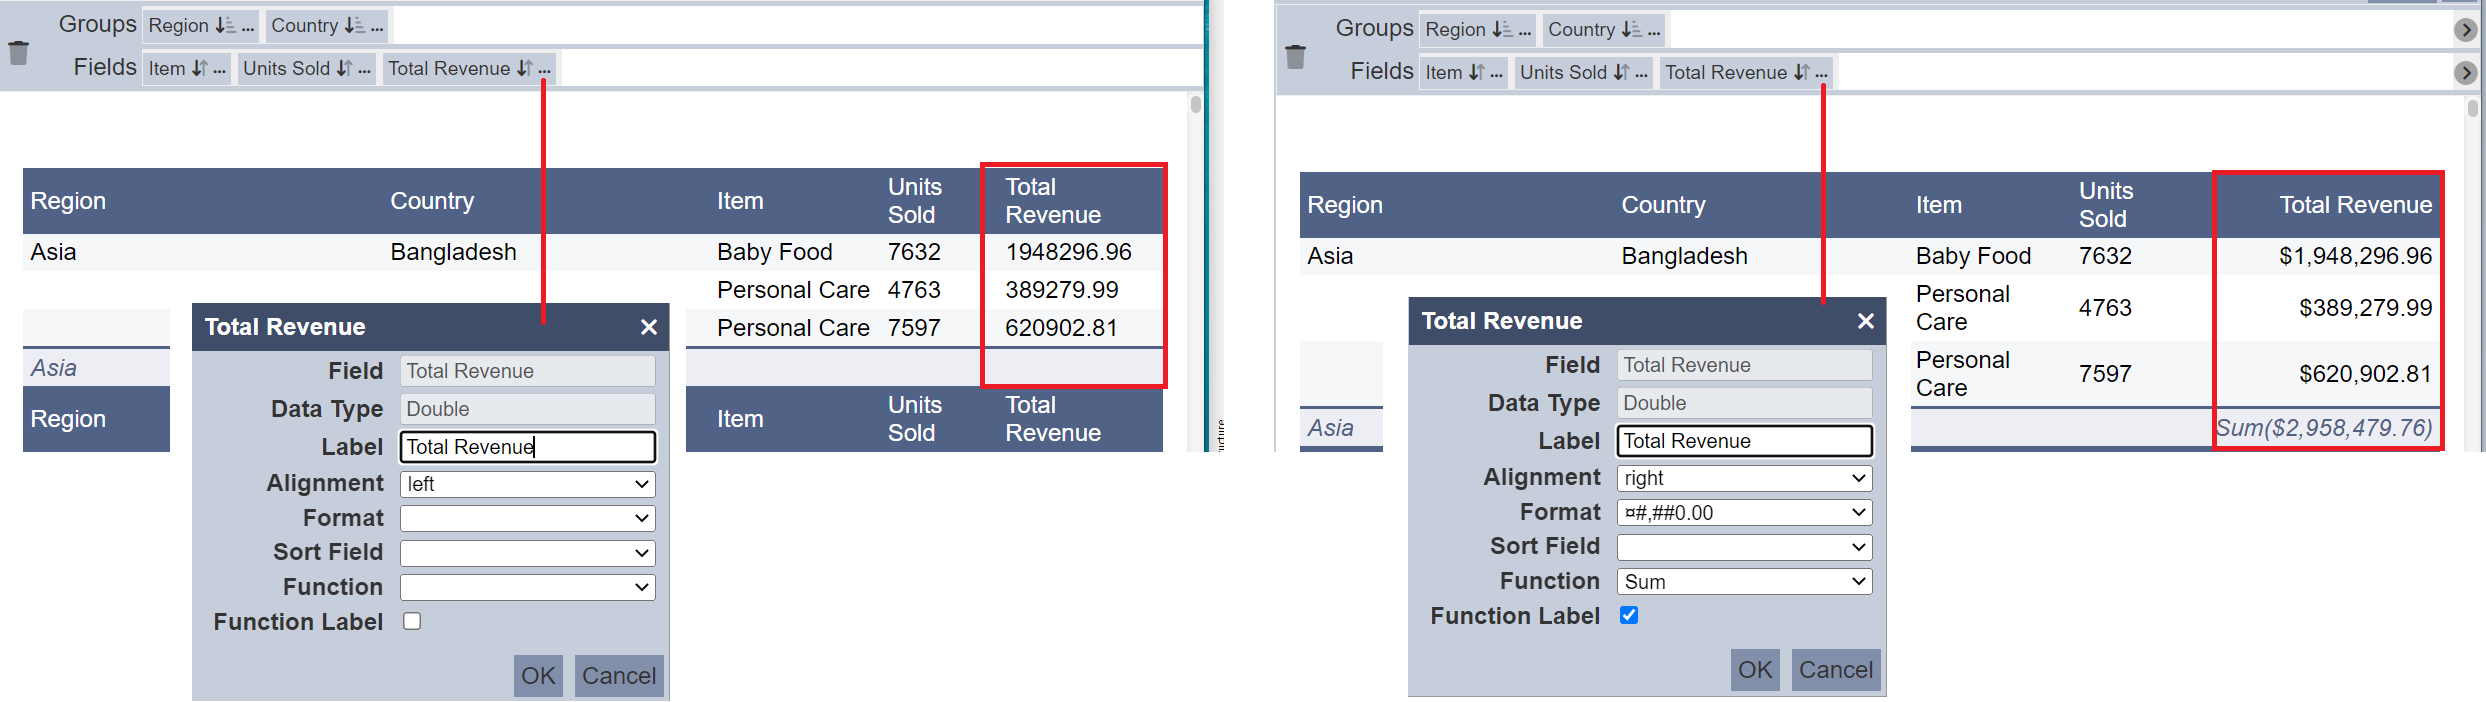
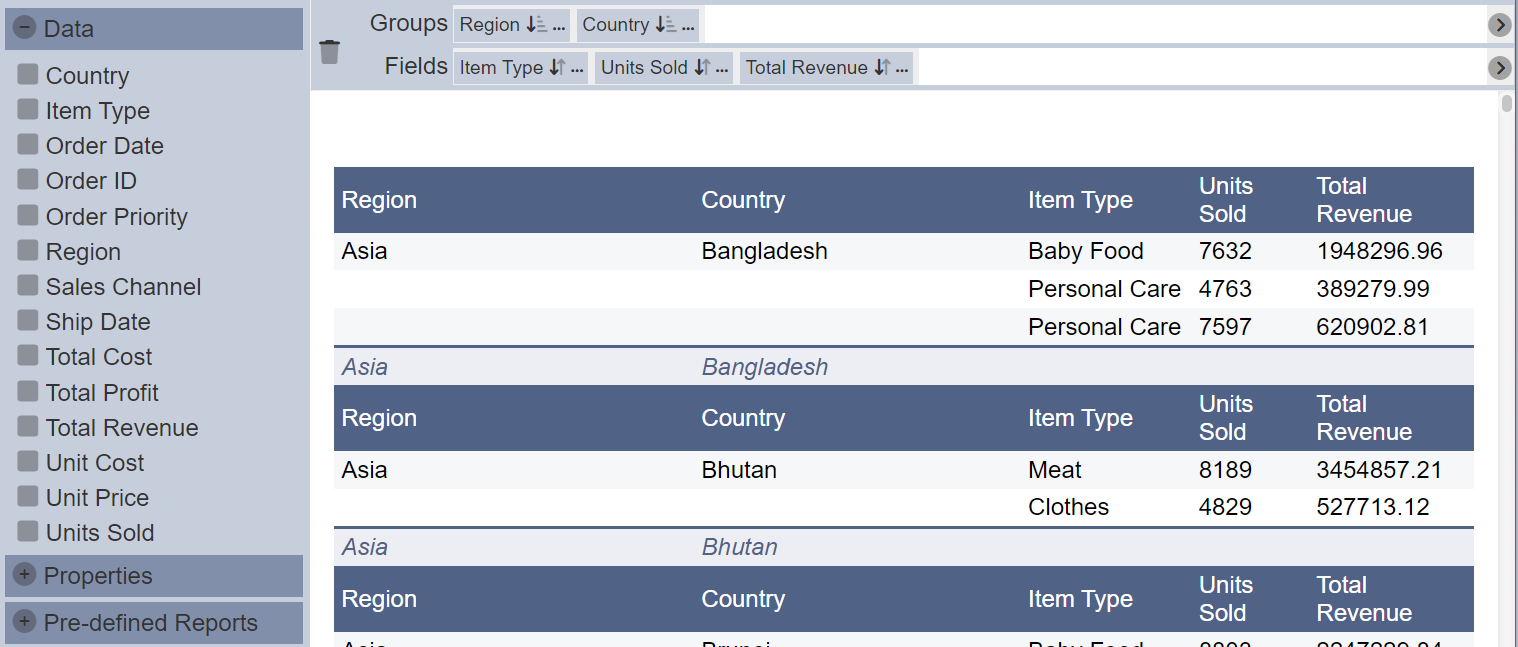
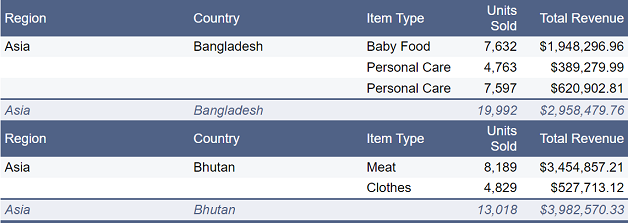
In the example below, the “Total Revenue” field displays numeric values with decimal places and is left aligned. These make it hard to read. The properties of the “Total Revenue” data can be set up to display the values aligned to the right and format the values to display currency symbol and values. The value of “Function”is displayed in the footer. This footer is defined in the data in the “Groups” field. In this case, there are “Region” and “Country”. If both of the “Footer” fields in these data are not selected, the value of “Function” will not appear in the report as there is no footer.
Lower Right Panel
The lower right panel displays the report based on the selected format and the values of the data that were selected in the “Groups” and “Fields” fields.
Example
Create Report
Below is an example of creating a report that shows sales data of countries from different regions.
Add Data
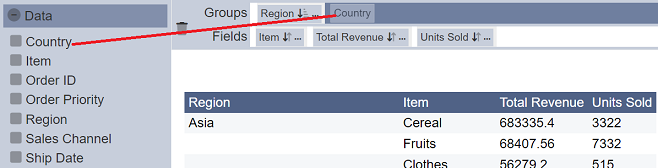
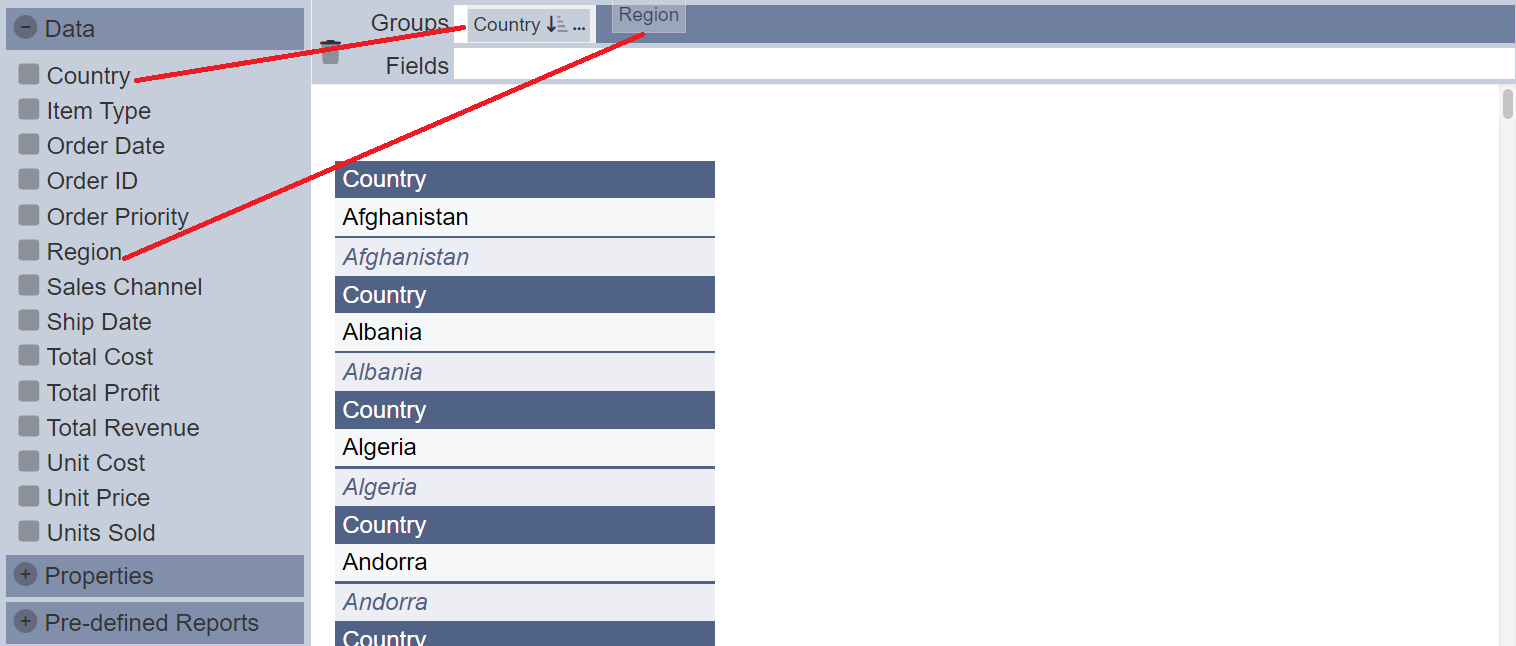
From the “Data” section in the left panel, drag and drop the desired data onto the “Groups” field. These data will act as the fields that group the other data together. More than one data can be added into the “Groups” field. In this case, “Region” and “Country” are selected.
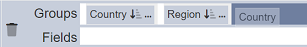
The order of the data defines how the data is presented in the report. If the order is not correct, they are be swap by drag-and drop to the correct position.
From the same section, drag and drop the desired data onto the “Fields” field. These data forms the details of the report. In this example, “Item Type”, “Units Sold” and “Total Revenue” are selected.
This example uses minimal data to create the report. If more data is used, the text field for the “Groups” and “Fields” fields may not be able to display all the data at the same time. At the far right of the “Groups” and “Fields” fields, you can find the  icon.
icon.

This icon allows you to view more data that are hidden. Click on the icon to reveil the next data. Notice that on the left another icon appears. this  icon allows you to reveil the previous data.
Format Data
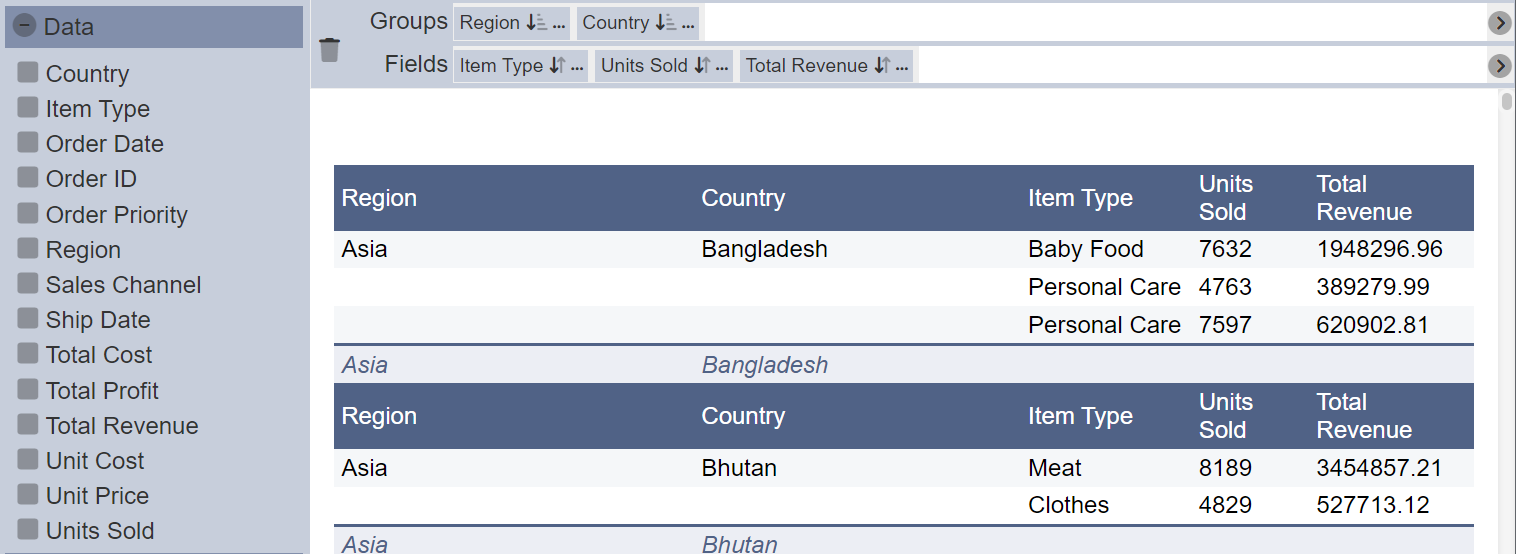
The values in the data by default are left aligned. For numbers, it is hard to read. In this report, two data is numeric, “Total Revenue” and “Units Sold”.
To edit “Units Sold”, click on the icon on the right of the data. In the dialog box, select “right” for the “Alignment” field. Select “#,##0” from the drop-down list in the “Format” field. If it is desired to show the sum of the units sold for each country, select “Sum” from the “Function” field.
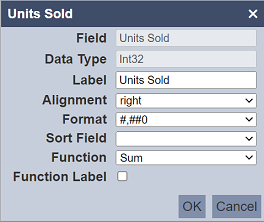
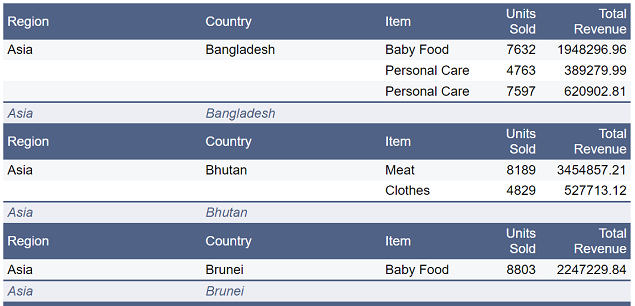
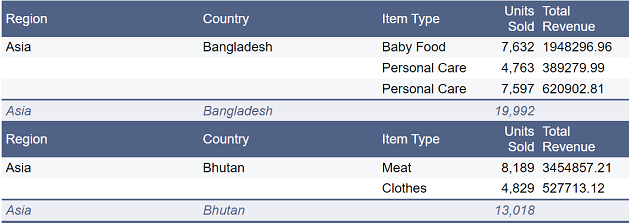
Click on the “OK” button to save the changes. The column for “Units Sold” is now right aligned, formatted and the sum is displayed in the row below.
To edit “Total Revenue”, click on the icon on the right of the data. In the dialog box, select “right” for the “Alignment” field. In the “Format” field, the desired format. If it is desired to show the sum of the revenue for each country, select “Sum” from the “Function” field.
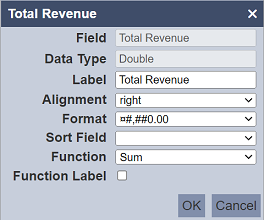
Click on the “OK” button to save the changes. The column for “Total Revenue” is now right aligned, shows the currency symbol and format, and the sum is displayed in the row below.
You may notice that the “Item Type” column is not sorted. To sort the items in ascending order, click on the ![]() icon next to the data in the “Fields” field.
icon next to the data in the “Fields” field.
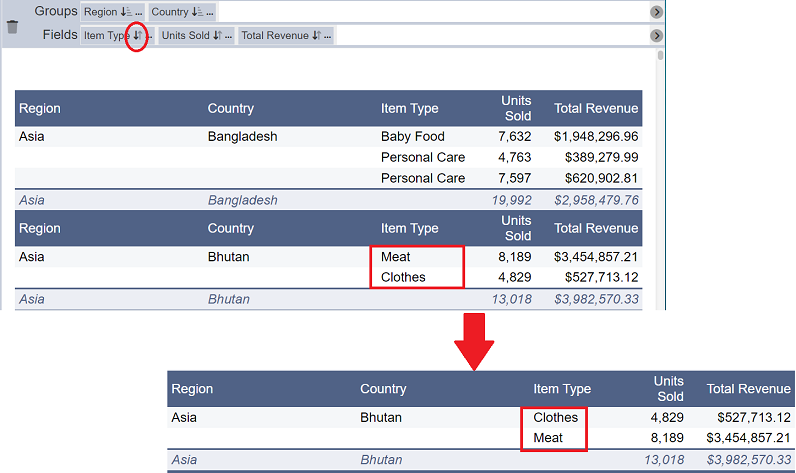
Report Format*
When the report is initially created, the default format for the report is “Block”. To change the format, click on the icon at the upper right corner of the page, next to the “Save” button.
In the pop-up menu, select “Report Display Settings”.
Select the desired number of records to display and the desired layout.
Click on the “Save” button to save the changes.
The report can be export into an Excel file via the “Export Excel” option from the icon.
Sort Field
The “Sort Field” allows you to use other field to sort the current field.
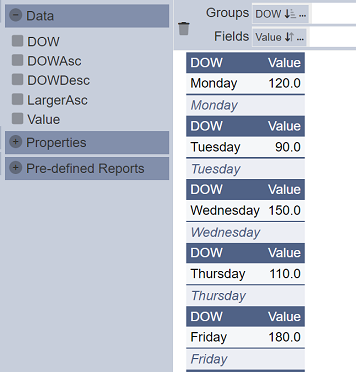
In the simple example below, the “DOW” is selected for the “Group” field and “Value” is selected for the “Field” field,
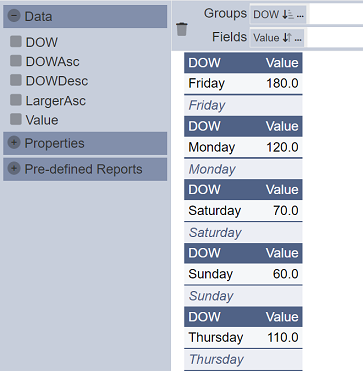
The values for “DOW” is not sorted in ascending order (default). It is easier to read the report if the data is sorted according to weekdays (i.e., Monday to Sunday),
To do so, click on the icon next to “DOW” in the “Groups” field. In the dialog box that appear, select “DOWAsc” field from the drop-down list of the “Sort Field” field.
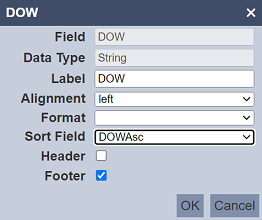
Click on the “OK” button to save the change. The report now displays the data in weekdays.
You can also set the sort field from the “Edit” panel of the report in the management page.
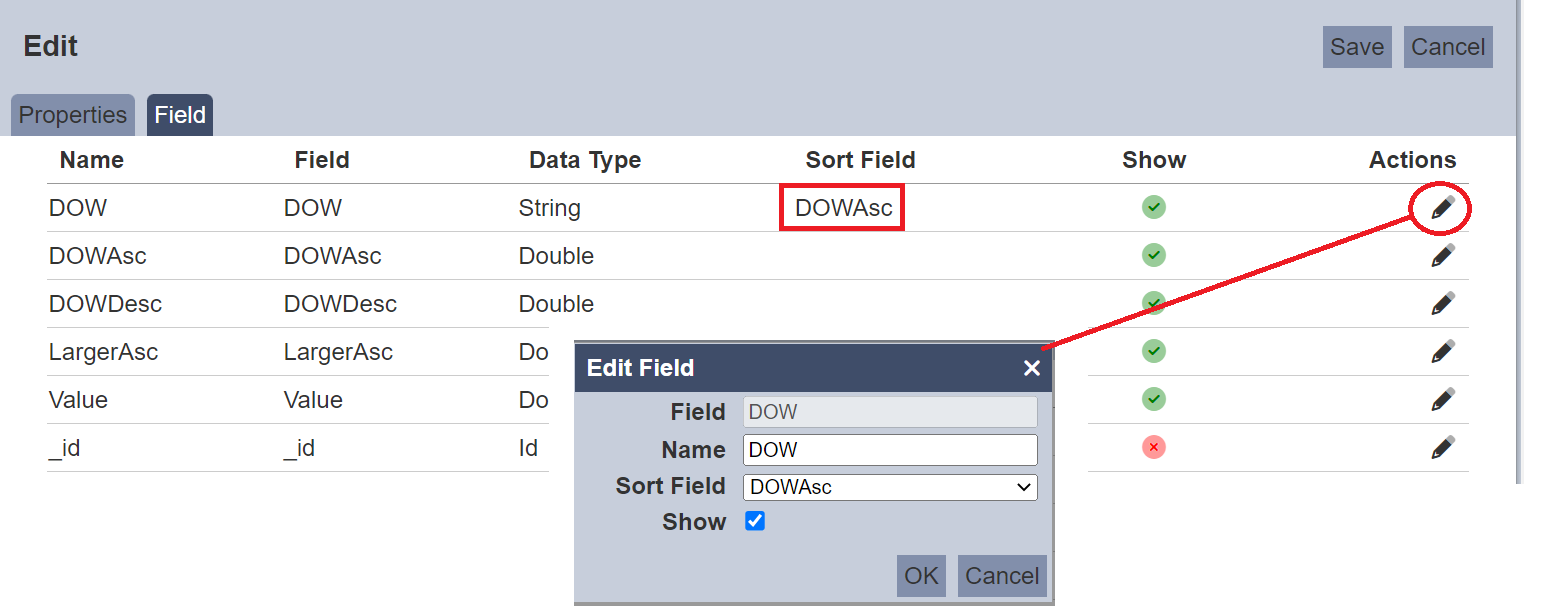
Click on the icon under the “Actions” column corresponding the desired field. In the “Edit Field” dialog box, select the desired field from the drop-down list in the “Sort Field” field. Click on the “OK” button to save the change. The select sort field will appear under the “Sort Field” column.