
Dashboard Views
Description
Certain dashboard views, and their settings and arrangements are quite standard for their destined purpose. It is practical to customise these views with their properties set up (such as hidden columns, records, cell selections, filters settings, etc.), and ready for other users to use. This can help beginners to start building up their own views easily.
The Dashboard Views module allows you to add, upload, edit, delete and download customised dashboard views. These views can be used in dashboards by other users. This will ease other users the hassle of setting up the dashboard view. They can simply add the view into their dashboard in a few clicks.
Module Interface
| Interface | Description | Required Privilege |
|---|---|---|
| Dashboard Views | Allows Dashboard Views access | mod-dashboard-views |
Add Dashboard View
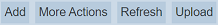
To add a dashboard view, click on the “Add” button at the upper right corner of the page.
In the “New Dashboard View” dialog box, key in a unique name for the new dashboard view in the “Name” field. Select the dashboard that contains the desired view in the “Dashboard” field. In the “View” field, select the desired dashboard view. Do note that if any of the dashboard views in the selected dashboard does not have a title, they will not appear in the drop-down list.
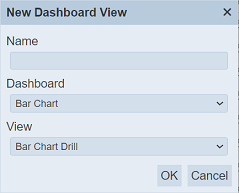
Click on the “OK” button to add the new dashboard view. Clicking on the “Cancel” button aborts the action.
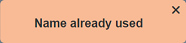
If the dashboard name already exist or the name is left blank, the relevant error message will appear.
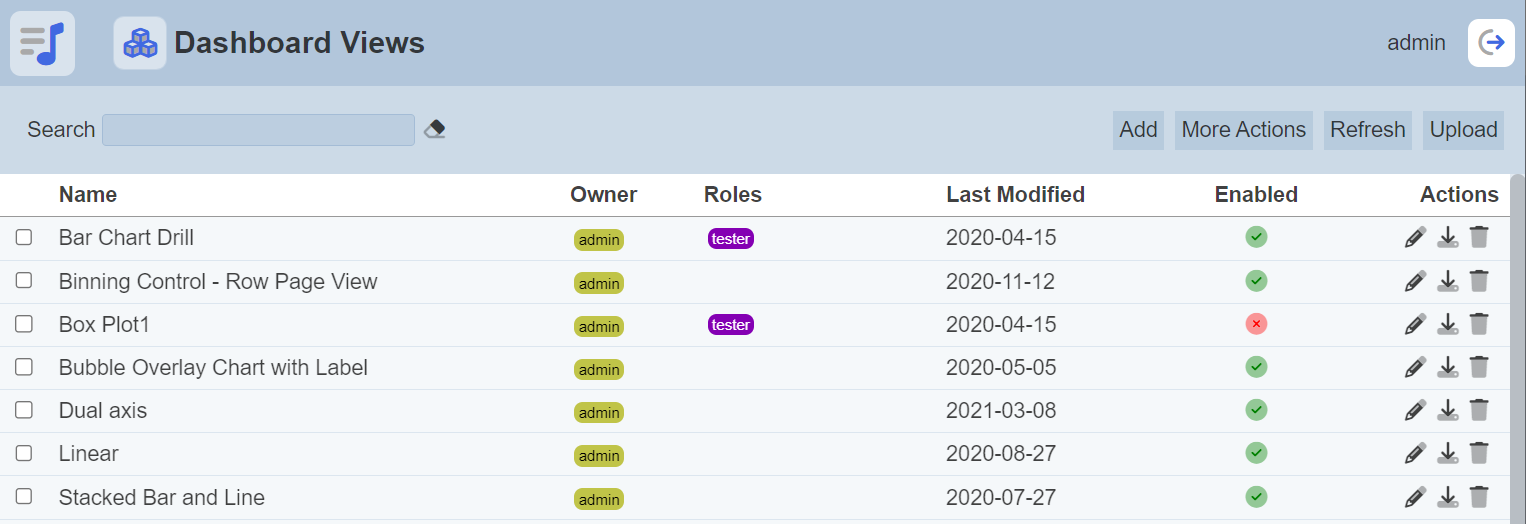
By default the new dashboard view added is enabled and displayed in the Dashboard Views page with a green tick under the “Enabled” column. Also, by default no roles are selected for the dashboard view.
To change these settings, click on the “Edit” icon under the “Actions” column corresponding the desired dashboard view. In the “Edit” panel, you can unselect the “Enabled” field to disable the dashboard view and/or select the desired role(s) allowed to access the dashboard view. The disabled dashboard view is displayed in the Dashboard Views page with a red cross under the “Enabled” column.
Edit Dashboard View
To edit the dashboard view, click on the  “Edit” icon under the “Actions” column corresponding to the desired dashboard view.

In the “Edit” dialog box, you can perform the following:
- Change the name of the dashboard view (name must be unique)
- Enable or disable the dashboard view
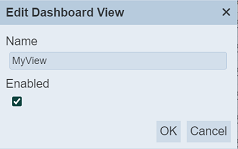
Click on the “Save” button to save the changes. Click on the “Cancel” button to abort the action.
Upload Dashboard View
To upload a dashboard view, click on the “Upload” button at the upper right corner of the page.
In the “Upload Dashboard View” dialog box, browse to the location of the JSON file to be uploaded.
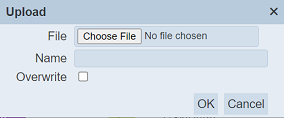
By default, the file name of the file is used in the “Name” field. You can change it if desired. Do note that the name must be unique, else an error message will appear.
If the file to be uploaded is to replace an existing view, ensure to select the “Overwrite” field and the name must match the existing dashboard view to be replaced.
Click on the “OK” button to upload the dashboard view. Click on the “Cancel” button to abort the action. Upon successful uploading, a message will appear.
By default the uploaded dashboard view is enabled and displayed in the Dashboard Views page with a green tick under the “Enabled” column. Also, by default no roles are selected for the dashboard view.
Download Dashboard View
To download a dashboard view, click on the  “Download” icon under the “Actions” column corresponding to the desired dashboard view.
The downloaded file has the following filename format <filename>.view.json.
Delete Dashboard View
To delete the dashboard view, click on the  “Delete” icon under the “Actions” column corresponding to the desired dashboard view.
There is an option to undo the deletion. A notification with an “Undo” button appears right after clicking on the “Delete” icon.
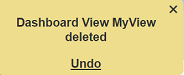
Upon clicking on the “Undo” button, the deleted dashboard view is restored and is added back to the list of dashboard views.
More Actions
This feature allows user to perform actions on multiple dashboard views at the same time.
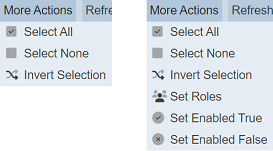
When the “More Actions” button located at the upper right corner of the page is clicked, a list of available actions are displayed.
If no dashboard view is selected prior clicking the button, there will be fewer actions available. To select a dashboard view, select the checkbox next to the name of the dashboard view.
| Option | Description |
|---|---|
| Select All | Selects all dashboard views in the list. |
| Select None | Unselects all dashboard views. |
| Invert Selection | Inverts the current selection. That is, any dashboard views selected will be unselected and vice versa. |
| Set Roles | Selects the roles to be assigned to the dashboard views. |
| Set Enabled True | When selected, sets the selected dashboard views to enable. |
| Set Enabled False | When selected, sets the selected dashboard views to disable. |
Set Roles
To set the roles for the selected views, click on the “More Actions” button and select the “Set Roles” option. The “Set Roles” dialog box will appear.
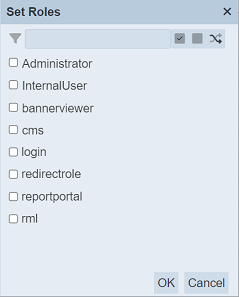
Select the roles to have access to the dashboard views by selecting the checkboxes. Alternatively, you can search for the desired role by keying in the keyword in the search function at the top of the dialog box. You can also choose to select all, select none or invert selection by clicking on their respective icons on the right of the search function.
Click on the “OK” button to save the changes or click on the “Cancel” button to abort the action.
Set Enabled True / False
To enable or disable the dashboard views, click on the “More Actions” button and select the “Set Enabled True” or “Set Enabled False” option respectively.
The selected views will be enabled or disabled as selected.
An enabled dashboard view is represented with a green tick under the “Enabled” column, while a disabled dashboard view is represented with a red cross.
Refresh
After performing actions on the browser/tab, the list of dashboard views may need to be reloaded to reflect any changes made to the page. The manual “Refresh” button is available and is particularly useful if there are others making changes on the same page or if multiple pages are opened.
The “Refresh” button is found on the upper right corner of the page. Clicking on it reloads the list.
Search
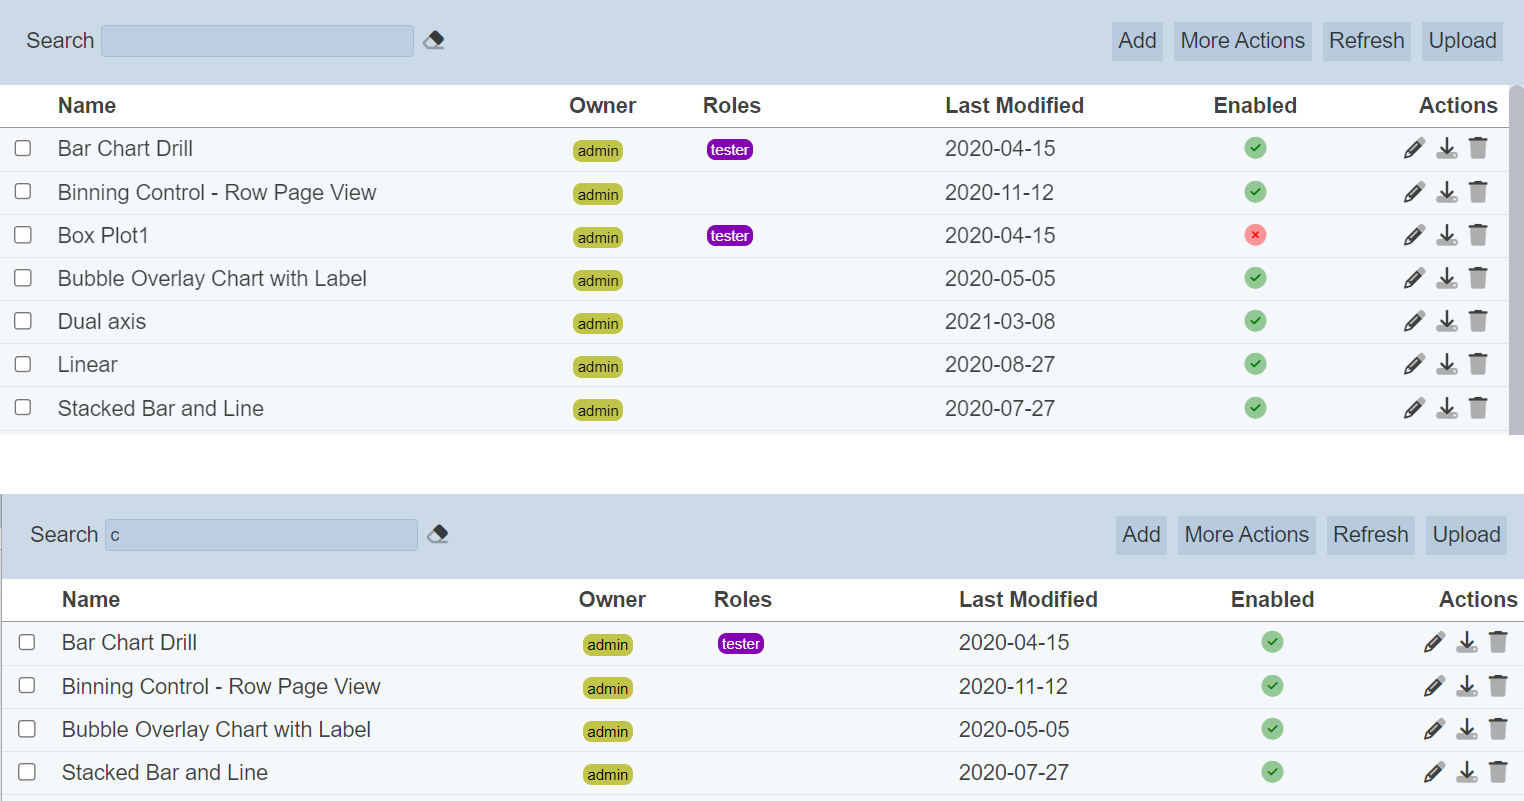
There is a cross-field search function for the list of dashboard views. It is located at the upper left corner of the page.

This provides an easy way to search through the dashboard view list. It is case-insensitive and displays files that have the entered search value in any of the values of the fields below:
- Name
- Owner
- Roles
- Last Modified
Alternatively, you can click on the any role or owner under the “Roles” or “Owner” columns respectively to aid the search for the views in the page.
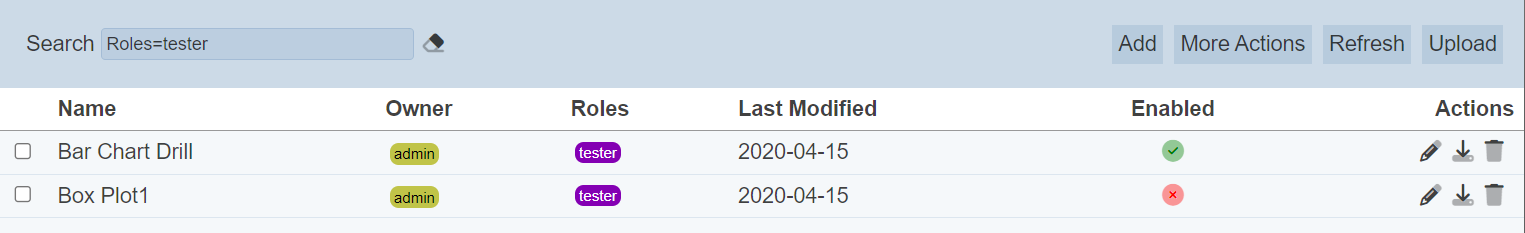
In the example above, views that are assigned the role “tester” are shown.
These two search methods can be combined together, with each criteria separated by a comma.