
Event Logs
Description
Logging is a way for a software suite to save any event records within the suite to a file for further analysis later. By logging and analysing events, it can help build a trend of what normality looks like in the environment. Then if anything goes wrong, these event logs can investigate the problem easier.
The Events Log Viewer allows you to view the events that were logged in Ambience. There are filters that allow you to select the start and end dates and filter the desired data to view. The log viewer displays a limit of 500 records. You can also download the log in CSV or JSON format.
Module Interface
| Interface | Description | Required Privilege |
|---|---|---|
| Event Logs | Allows access to Event Logs page. | mod-events-log-viewer |
Log Parameters
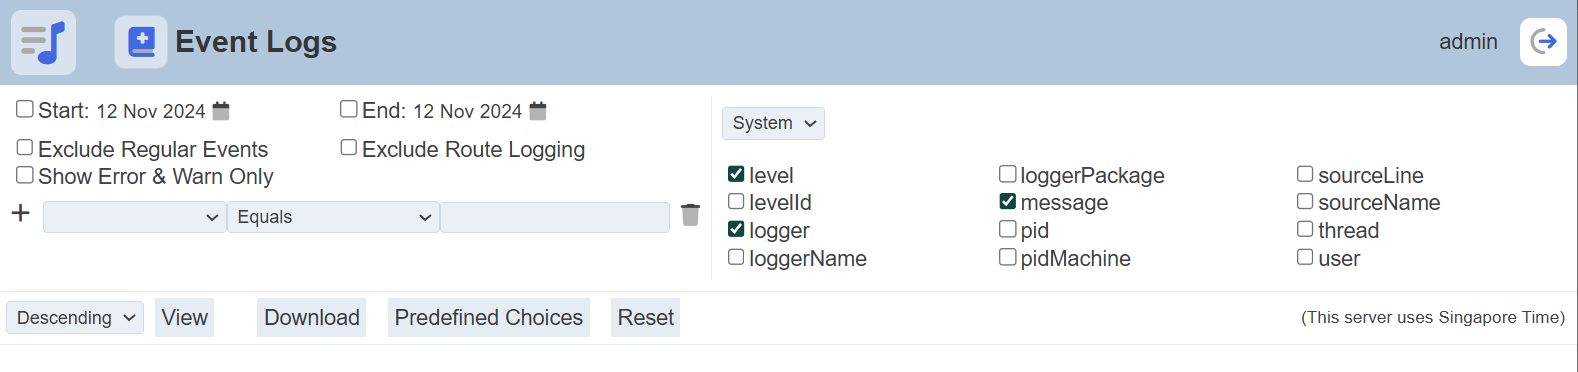
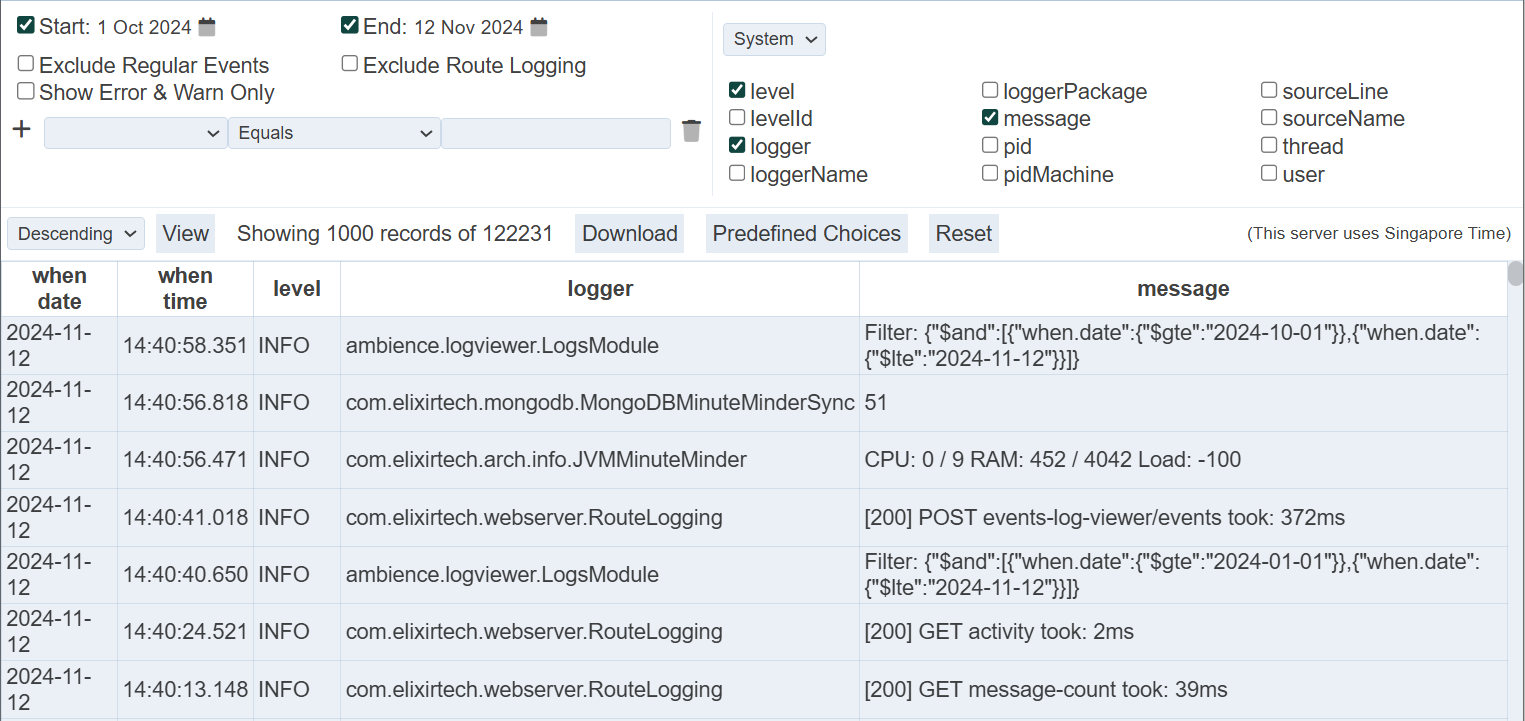
There are three panels in the Event Logs.
The left panel allows you to select the desired start and end dates, and filters for the log. The right panel allows you to select the desired column fields to be displayed and it consists of two pages; namely “System” and “When”.
The results panel at the lower half of the page will display only the top row during initial launch. The results will appear below the top row after a search is conducted.
Left Panel
The left panel allows you to select the start and end dates, as well as setting up the filters.
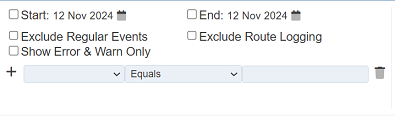
To select the start date, select the checkbox on the left of the “Start” field. By default, the current date is used. To choose another date, click in the  “Calendar” icon and choose the desired date. Do the same for the end date.
There are four types of filters:
- “Exclude Regular Events” filter
- “Exclude Route Logging” filter
- “Show Error & Warn Only” filter
- Criteria filter
Exclude Regular Events
The “Exclude Regular Events” filter allows you to excludes regular events from the log, such as AmbienceAgenda (e.g., hourly scheduled activity) and MinuteMinder (records server statistics every minute).
Exclude Route Logging
The “Exclude Route Logging” filter allows you to exclude route logging events from the log.
Show Error & Warn Only
The “Show Error & Warn Only” filter allows you to display only error and warning events in the log.
Criteria
The Criteria filter allows you to filter the log according to parameters selected. For this filter, by default one blank filter is shown for you to enter your filter criteria (cannot be deleted) for you to enter your filter criteria. You can add more filters by clicking on the “+” icon.
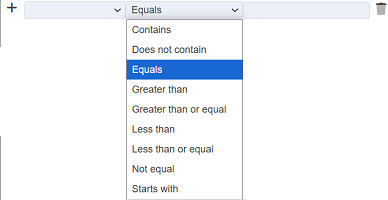
There are three components to form a criteria; namely the column field, operator and expression/value. The column field selects the column to filter. The expression defines the information to filter. The operator selects how the filter behaves along with the column field and expression.
When no column field and expression is defined, the entire log is displayed when the “View” button is clicked.
To create a criteria, click on the drop-down list to select a column. Select the appropriate operator in the centre drop-down list. The default operator is Equals. In the third textbox, key in the desired expression or value. To clear or delete a filter, click on the  icon. One or more criteria can be added by clicking on the “+” icon.
When using Contains or Starts with for string comparison, regular expressions are used. The [ and ] characters are reserved to indicate a range of characters. For example,
[Ss]haron
will find “Sharon” and “sharon”.
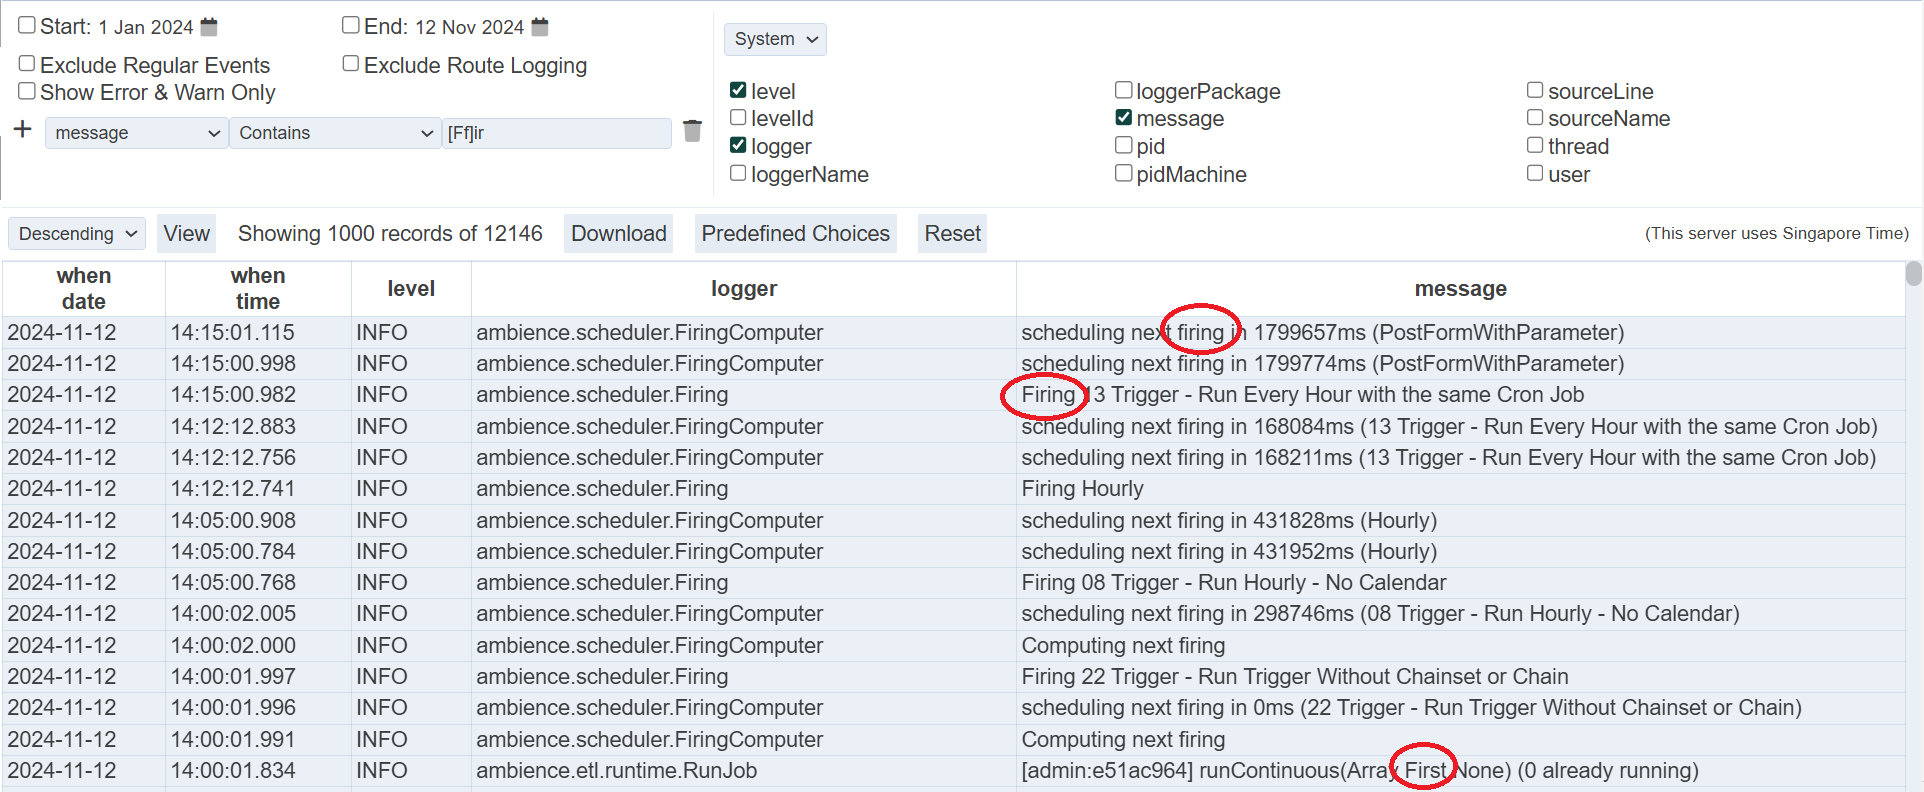
In the example below, [Ff]ir will find any string that contains with Fir and fir, such as Firing, firing and Fire.
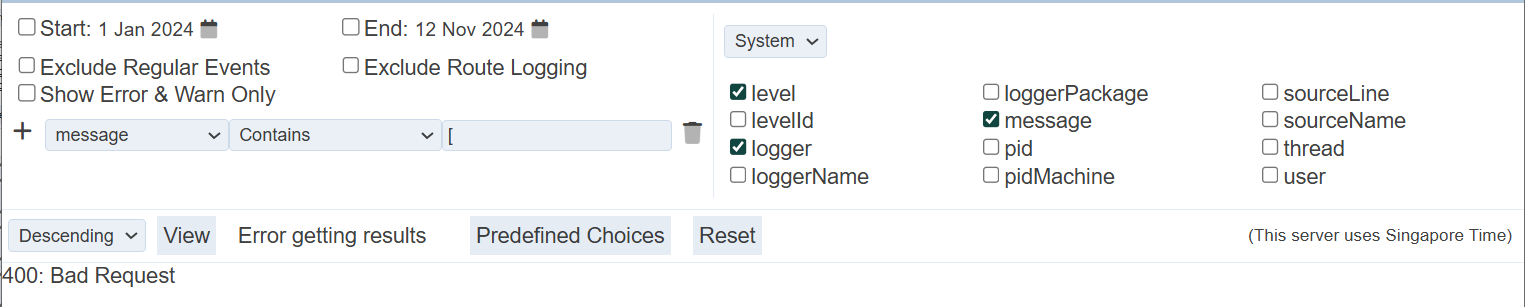
Since the [ character is reserved, using it by itself will result in an error message.
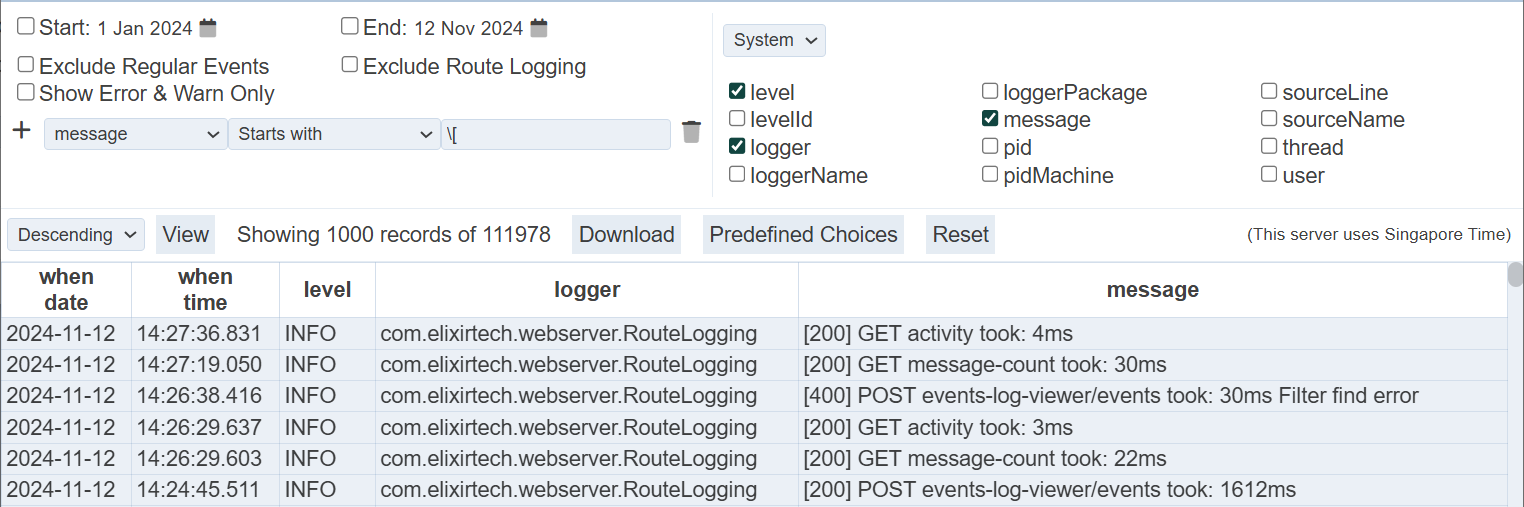
To use the reserved characters, place a \ character in front of them. In the below example, to find messages that starts with the [ character, a \ is placed in front it.
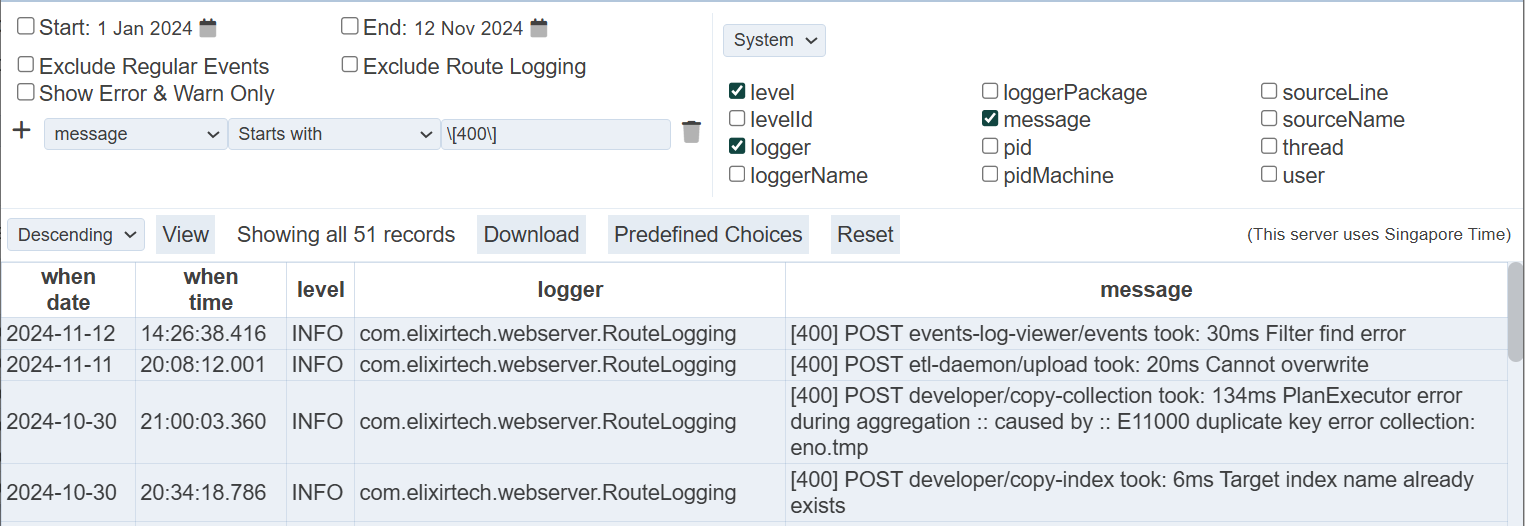
In the second example, to find messages that starts with the string “[400]”, a \ character is placed in front of the [ and ] characters.
There are other quantifiers that can be used along with the regular expressions, such as ().*?^.
Right Panel
The right panel allows you to select the column fields to be displayed in the viewer. In consists of two pages:
- System - allows you to select the system parameters
- When - defines when the event occurs
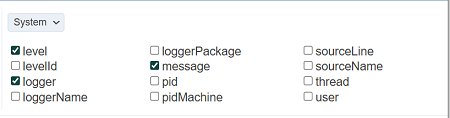
By default, the “System” page is displayed with default fields. You can change the setting by selecting or unselecting the fields in the panel.
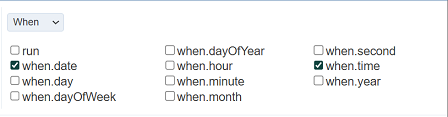
To go to the “When” page, click on “System” and select “When”. The fields available for “When” will appear. Select or unselect the fields according.
Note the “When” option “run” is the unique value for which server session. If you are only interested in things that happened this time you ran the server, then look at the system information:
The Run ID is the number of times you have started Ambience. You can filter by run = 461 to only see events from the current server session. If you stop and restart, Run ID will be 462.
Results Panel
The results panel at the lower half of the page will display only the top row during initial launch. The results will appear below the top row after a search is conducted using the parameters from the left and right panels.
The top row consists of several buttons.

View
This function allows you to view the logs with the parameters set in the left and right panels.
Set the desired parameters in the left and right panel and click on the “View” button.
By default, it is in descending order. To view the logs in ascending order, select “Ascending” from the drop-down list on the left of the “View” button.
Download
This function allows you to download the log in the results panel.
Click on the “Download” button and select the desired output format from the list.
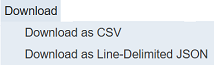
The downloaded file has the file name Event-Records.<ext>.
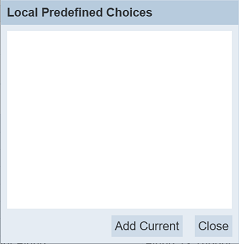
Predefined Choices
This function allows you to store, apply and delete predefined parameters for the event log. This will ease selecting the same set of criteria settings each time the same log is required.
The parameters settings of the predefined choices are local and per user only.
Add
To add the current criteria settings as a predefined choice, click on the “Predefined Choices” button from the top row.
The “Local Predefined Choices” dialog box will appear.
Click on the “Add Current” button in the dialog box. The “Add Current” dialog box will appear.
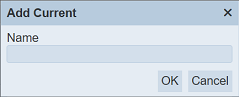
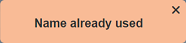
Key an unique name for the current parameters and click on the “OK” button. If the name already exist or no name is entered, error message will appear.
Upon successfully adding the criteria settings, the predefined choice will be added into the “Local Predefined Choices” dialog box.
Apply
To apply the criteria settings of a predefined choice, click on the “Predefined Choices” button from the top row.
The “Local Predefined Choices” dialog box will appear.
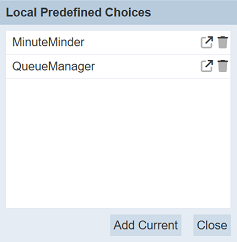
Click on the  “Apply” icon on the right of the desired choice. The “Local Predefined Choices” dialog box will close and the settings will be applied to the left and right panels.
Delete
To delete a predefined choice, click on the “Predefined Choices” button from the top row.
The “Local Predefined Choices” dialog box will appear.
Click on the “Delete” icon on the right of the desired choice. The predefined choice will be removed from the list. Click on the “Close” button to close the dialog box.
Reset
The “Reset” button allows you to reset the Event Logs page to its initial settings. It is useful to remove previous settings and start afresh.
Viewer Usage
To generate the events log, select the desired date range and set up the filters in the left panel. In the right panel, select the desired column fields in the “System” and “When” panels.
Click on the “View” button and the events log will appear in the panel below.
By default the log is in descending order. You can re-sort the log in ascending order by clicking on the “Descending” field and select “Ascending” from the drop-down list.
If the generated log does not have the column fields you desire, you can add the columns by selecting the column field checkboxes in the right panel and vice versa.
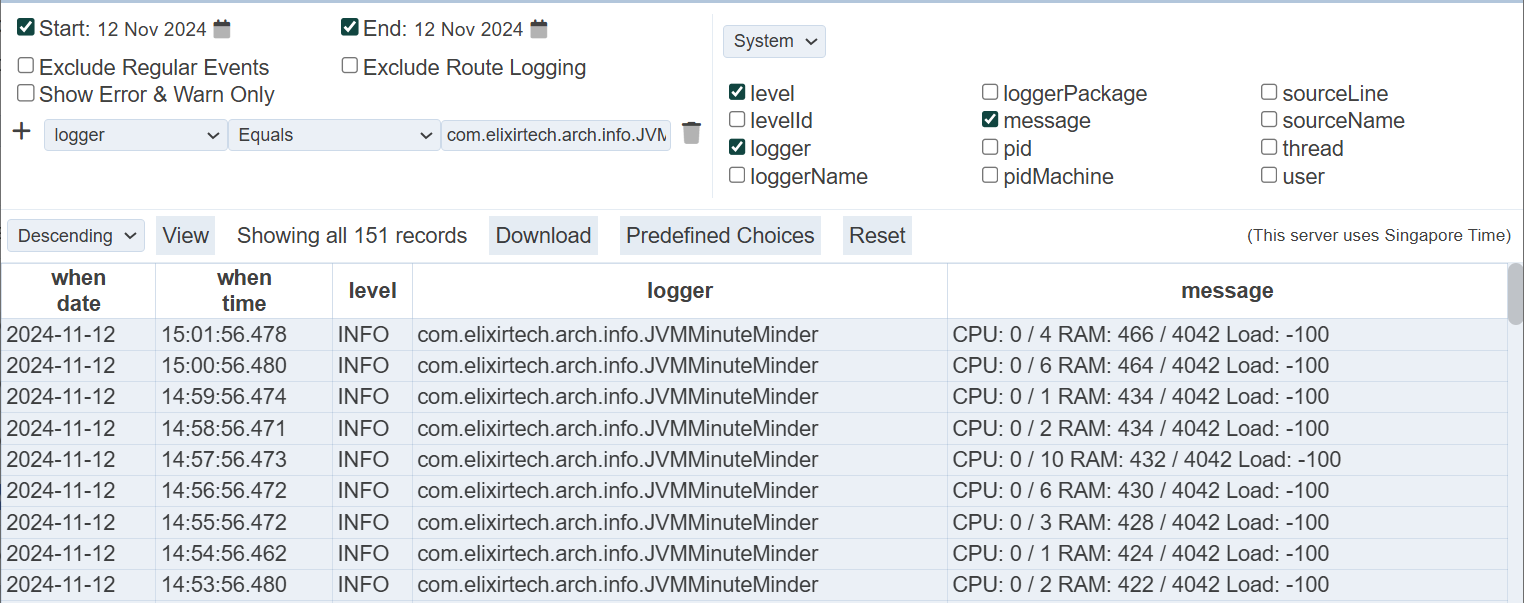
You can add the third filter by clicking on the desired cell field, for example, JVMMinuteMinder in the “logger” column. The filter will automatically fills up. By default, the “Equal” operator is selected. If it is not the desired operator, click on the “Equals” operator and select the desired operator from the drop-down list.
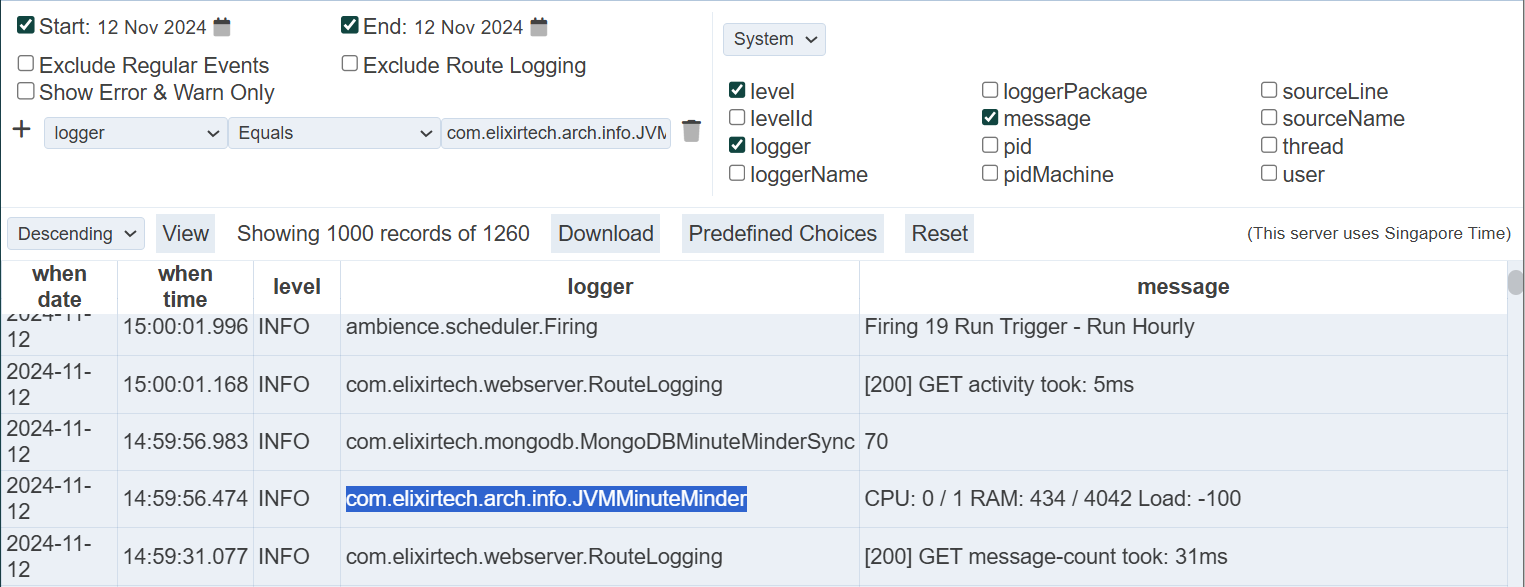
Click on the “View” button to re-generate the log. Now the events with selected field are displayed.
The log can be downloaded by clicking on the “Download” button that appear in the page and select a format option from the drop-down list.
The log can be downloaded either in CSV or JSON format.
More filters can be added to further query the log. Click on the “+” icon on the left of the filter and a new filter wil lbe added below the current one.
When the same field is used on the filters, their operations are ANDed if the options include “Greater than”, “Greater than or equal”, “Less than”, “Less than or equal”, “Not equal” or “Contains”. If different fields are used, they are ORed.
For example, A>1, A<9 and A=20 are set as filters, they are ANDed and will have no results. But A=10 and A=20 will have results as they are ORed. To elaborate further, A=1 AND A=2 does not make sense. A starts with “ABC” AND A starts with “DEF” does not make sense as well. But A contains “X” AND A contains “Y” is possible.