
Visualisations
Description
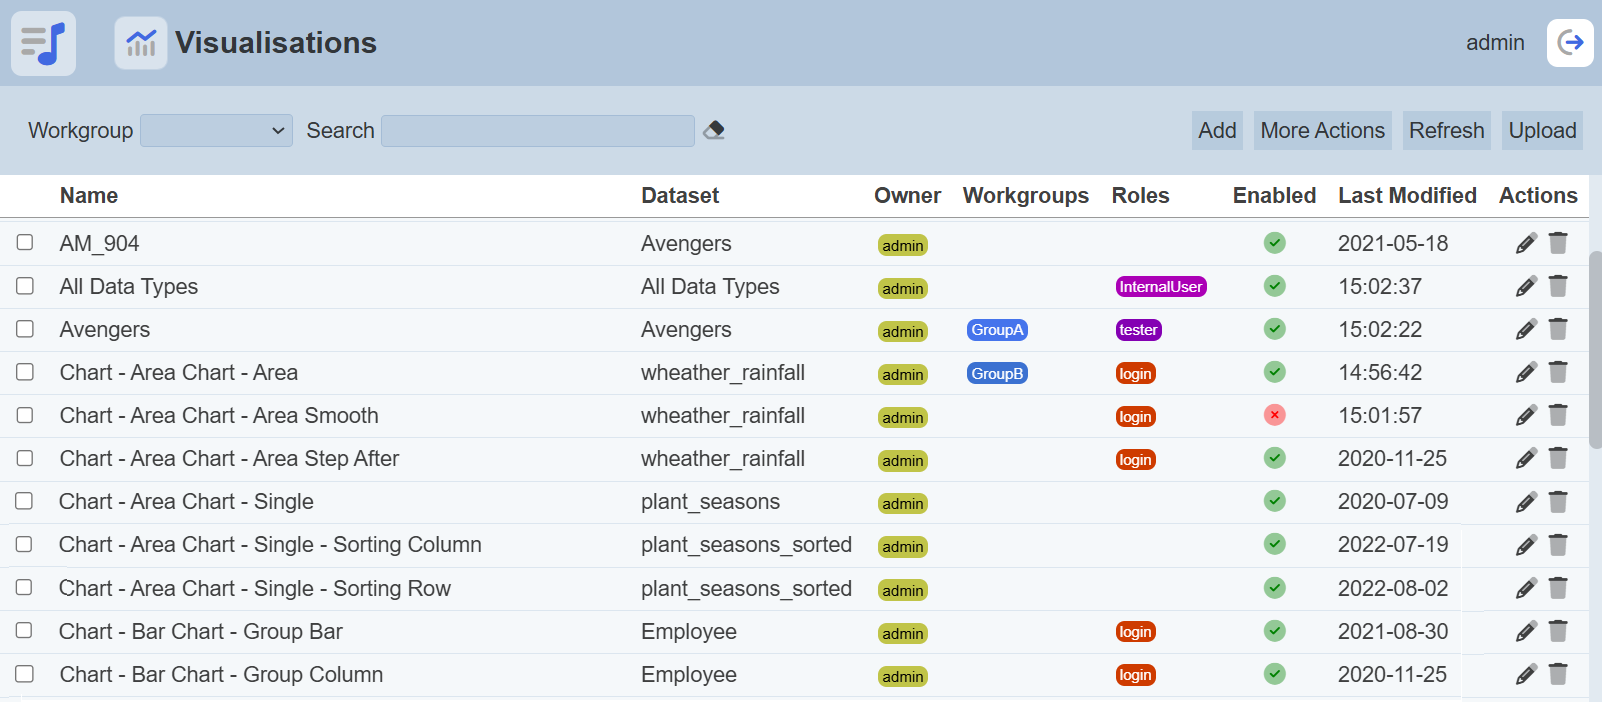
Data visualisation is a method to translate information into a visual context, such as a map or graph, to make data easier for users to understand. Its goal is to make it easier to identify pattern, trends and outliers in large data sets.
The Visualisations module provides a simple interface to create chart, view or table easily.
Only the owner can access and edit the visualisation.
Module Interfaces
| Interface | Description | Required Privilege |
|---|---|---|
| Visualisations | Allows access to Visualisations page. | mod-viz |
| Visualisations | Allow to edit visualisation metadata. | mod-viz-edit |
| Visualisations | Allows visualisation interactive access. | mod-viz-interactive |
| Visualisations | Allow to edit visualisations. | mod-viz-interactive-edit |
Add Visualisation
To add a visualisation, click on the “Add” button at the upper right corner of the page.
The “New Visualisation” dialog box will appear.
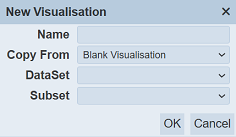
In the “Name” field, key in an unique name for the new visualisation. You can either copy from an existing visualisation from the drop-down list or create a blank visualisation by selecting “Blank Visualisation” in the “Copy From” field. Select a dataset from the drop-down list in the “DataSet” field. In the “Subset” field, select a subset from the drop-down list (optional). Click on the “OK” button to create the new visualisation or click on the “Cancel” button to abort the action.
Upon successful creation, the Visualisation Designer page will appear.
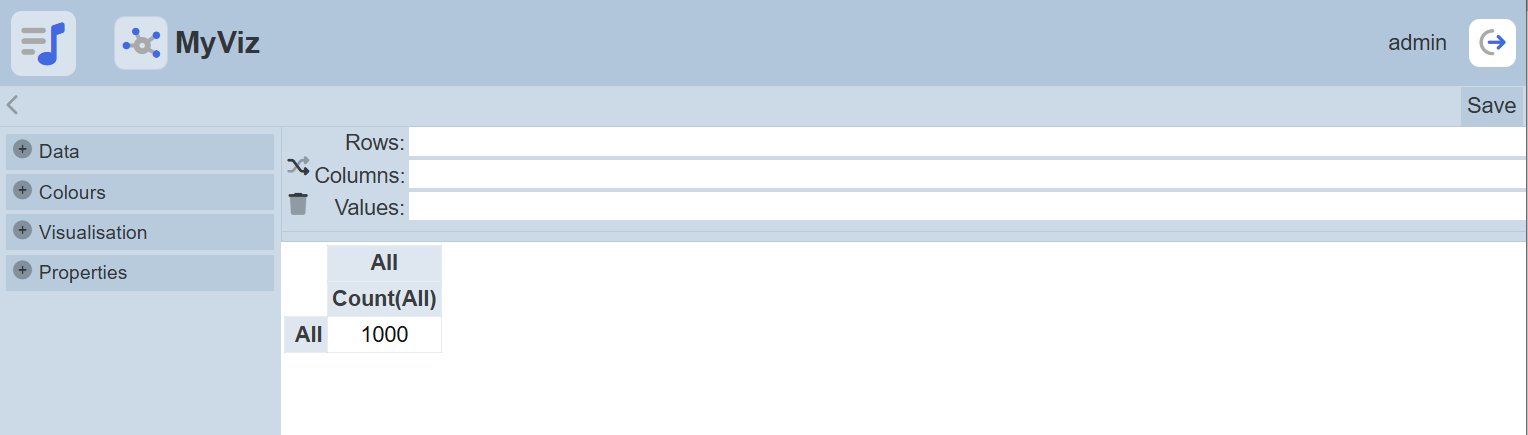
Refer to Visualisation Designer for more information.
Refresh Page
After performing actions on the browser/tab, the list is reloaded to display the list of visualisations. The manual “Refresh” button is available and is particularly useful if you have opened multiple pages and are making changes in these pages.
The “Refresh” button is found on the upper right corner of the page. Clicking on it reloads the list of visualisations.
Upload Visualisation
To upload a visualisation, start by clicking on the “Upload” button on the upper right corner of the page.
The “Upload” dialog box will appear.
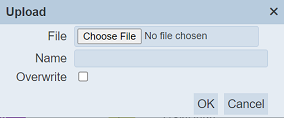
Single File
Browse to the location of the visualisation JSON (.json) file to be uploaded and key in an unique name in the “Name” field. If the visualisation to be uploaded is to replace an existing visualisation, select the “Overwrite” field. Click on the “OK” button to upload the visualisation. Click on the “Cancel” button to aborts the action.
Upon successful uploading, a message will appear.
Zip File
Browse to the location of the zip file to be uploaded. The name of the visualisations will be extracted from the zip file. Click on the “OK” button to upload the visualisations. The “Upload Results” dialog box will display the results of the uploading.
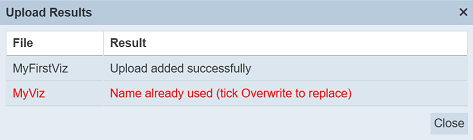
Those results in black are uploaded successfully while those in red indicates upload failures with their relevant messages. Click on the “Close” button to close the dialog box.
Edit Visualisation
This feature allows you edit the properties of the visualisation, as well as the roles who can access the visualisation. To edit the visualisation, click on the  “Edit” icon under the “Actions” column corresponding to the desired visualisation.
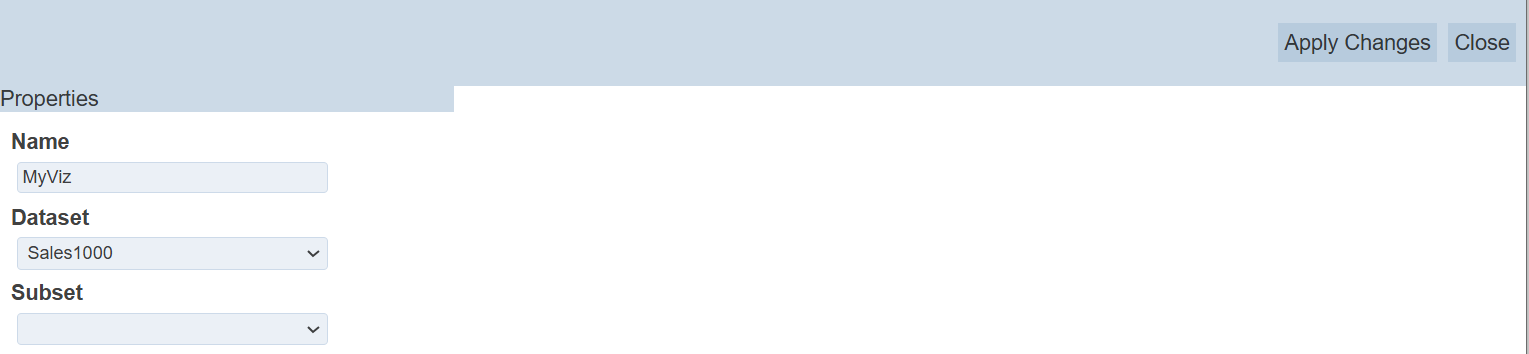
The “Edit” panel will appear.
Edit the name, dataset and subset of the visualisation. Do note that the name need to be unique.
Click on the “Save” button to save the changes. Clicking on the “Cancel” button aborts the action.
Open Visualisation
To open a visualisation allows you to edit the metadata of the visualisation. You need to have the mod-viz-interactive-edit privilege to do so.
Click on the name of the visualisation under the “Name” column.
The Visualisation Designer page will appear.
Refer to Visualisation Designer for more information.
More Actions
This feature allows user to perform actions on multiple visualisations at the same time.
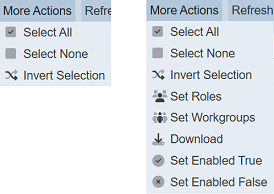
When the “More Actions” button located at the upper right corner of the page is clicked, a list of available actions are displayed.
If no visualisation is selected prior clicking the button, there will be fewer actions available. To select a visualisation, select the checkbox next to the name of the visualisation.
| Option | Description |
|---|---|
| Select All | Selects all visualisations in the list. |
| Select None | Unselects all visualisations. |
| Invert Selection | Inverts the current selection. That is, any visualisations selected will be unselected and vice versa. |
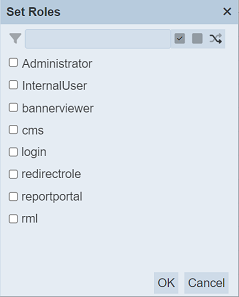
| Set Roles | Selects the roles to be assigned to the visualisations. |
| Set Workgroups | Selects the workgroups to be associated with the visualisations. |
| Download | Downloads multiple visualisations as a zip file. If only one visualisation is selected, the selected visualisation will be downloaded as a JSON file. |
| Set Enabled True | When selected, sets the selected visualisations to enable. |
| Set Enabled False | When selected, sets the selected visualisations to disable. |
Set Roles
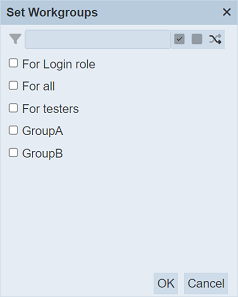
To set the roles for the selected visualisations, click on the “More Actions” button and select the “Set Roles” option. The “Set Roles” dialog box will appear.
Select the roles to have access to the visualisations by selecting the checkboxes. Alternatively, you can search for the desired role by keying in the keyword in the search function at the top of the dialog box. You can also choose to select all, select none or invert selection by clicking on their respective icons on the right of the search function.
Click on the “OK” button to save the changes or click on the “Cancel” button to abort the action.
Set Workgroups
To set the workgroups to be associated with the selected visualisations, click on the “More Actions” button and select the “Set Workgroups” option. The “Set Workgroups” dialog box will appear.
Select the workgroups to be associated with the visualisations by selecting the checkboxes. Alternatively, you can search for the desired workgroup by keying in the keyword in the search function at the top of the dialog box. You can also choose to select all, select none or invert selection by clicking on their respective icons on the right of the search function.
Click on the “OK” button to save the changes or click on the “Cancel” button to abort the action.
Download
To download the selected visualisations, click on the “More Actions” button and select the “Download” option.
If only one visualisation is selected, the downloaded visualisation has a filename of <filename>.visualisation.json.
If more than one visualisation are selected prior, the “Download” dialog box will appear.
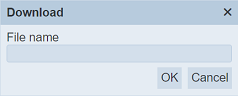
Key in the desired name for the zip file and click on the “OK” button. The selected visualisations will be downloaded as a zip file with the filename provided earlier. The individual visualisations in the zip file will have the filename format as mentioned above.
Set Enabled True / False
To enable or disable the visualisations, click on the “More Actions” button and select the “Set Enabled True” or “Set Enabled False” option respectively.
The selected visualisations will be enabled or disabled as selected.
An enabled visualisation is represented with a green tick under the “Enabled” column, while a disabled visualisation is represented with a red cross.
Delete Visualisation
To delete a visualisation, click on the  “Delete” icon under the “Actions” column corresponding the desired visualisation.

There is an option to undo the deletion. A notification with an “Undo” button appears right after clicking on the “Delete” icon.
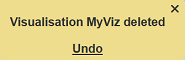
Upon clicking on the “Undo” button, the deleted visualisation is restored and is added back to the list of visualisations.
Workgroup
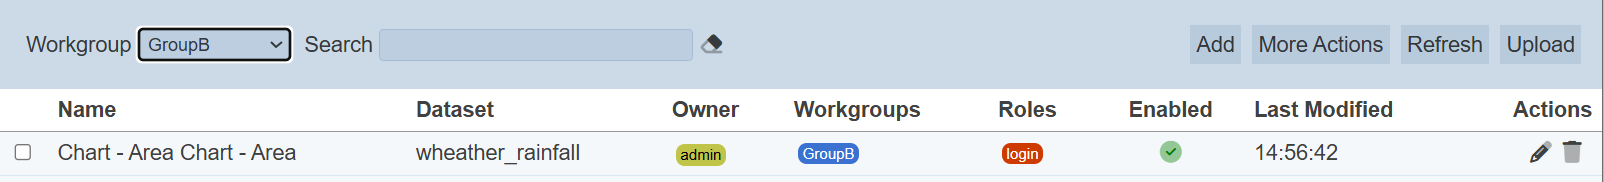
The “Workgroup” field at the top left corner of the page allows you to filter the visualisations associated with the selected workgroup.
Simply select the desired workgroup from the drop-down list and the visualisations associated with the selected workgroup will appear.
Do note that if no workgroup is created in the Workgroups module, the “Workgroup” field at the top left of the page will not appear.
Search
There is a cross-field search function for the list of visualisations. It is located at the upper left corner of the page.

This provides an easy way to search through the visualisation list. It is case-insensitive and display visualisations that have the entered search value in any of the values of the fields below:
- Name
- Dataset
- Owner
- Workgroup
- Roles
- Last Modified
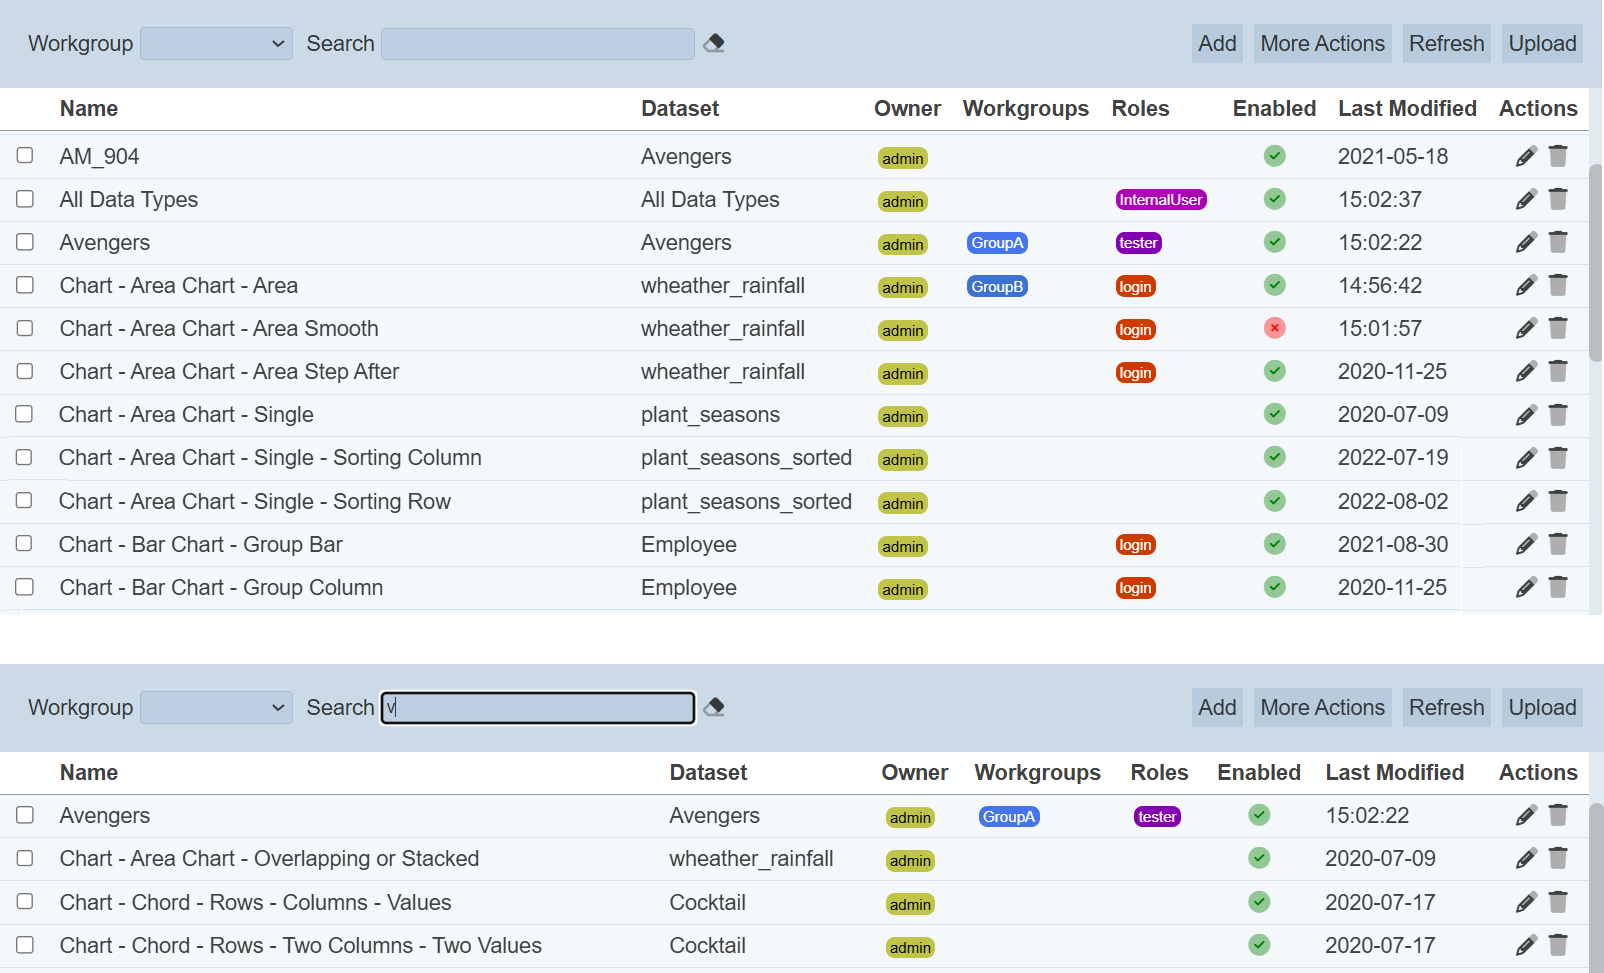
Alternatively, you can click on the any item under the “Dataset”, “Owner”, “Workgroups” and/or “Owner” columns respectively to aid the search for the visualisation in the page.
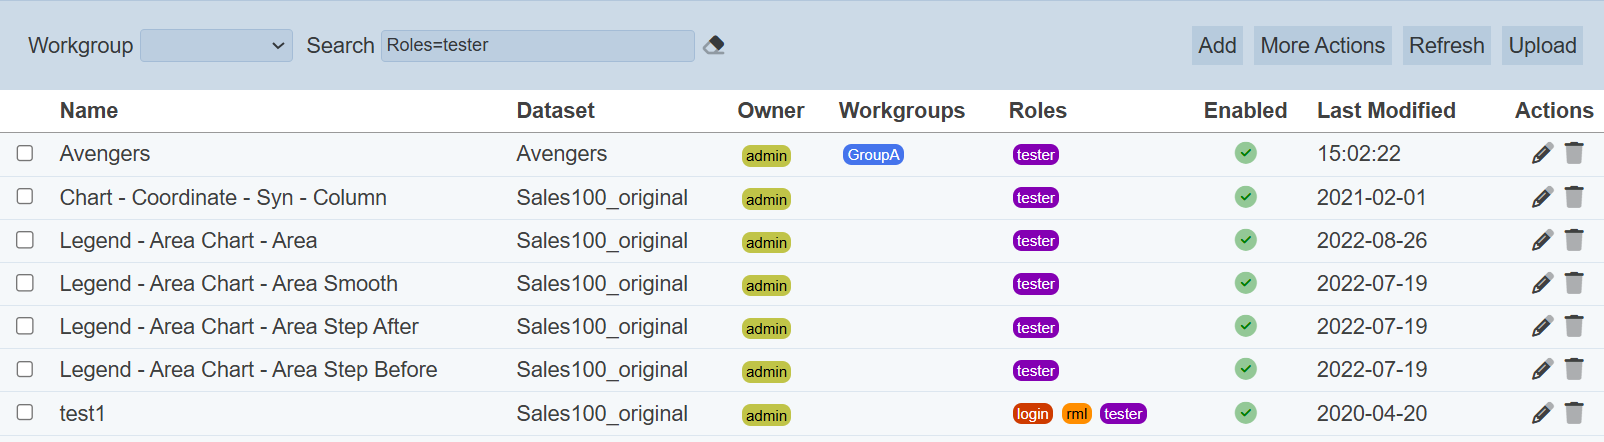
In the example above, visualisations that are assigned the role “tester” are shown.
These two search methods can be combined together, with each criteria separated by a comma.