
Data Designer
Elixir Data Designer is a tool used for creation and manipulation of data. It allows direct interaction with the data flow through a diagrammatic interface.
Users of IT systems face common problems such has:
- Growing volume of data - IT and business users are required to handle large volumes of data every day. Manual processing is both time-consuming and error-prone, leading to inefficient operations and an accumulation of mistakes.
- Proliferation of data - Business users work with different types of databases or applications. This leads to more complexity in data retrieval and manipulation.
The solution to these problems is to personalise the data sources, so that it becomes easier to manage them. Elixir Data Designer is a powerful tool that can perform extraction, aggregation, transformation and loading of multiple data sources. Further, since the designer provides a visual method of interaction with these data sources, a large amount of time can be saved while developing data manipulation strategies.
Elixir Data Designer provides on-demand data for business users. As this software is directly deployable from the web, it can be easily accessed by business users to satisfy their everyday needs. The tool also provides a flexible scripting mechanism, allowing an IT support team to build custom solutions that satisfy complex requirements.
Through direct manipulation and inspection of data sources and flows, a coherent view of the overall data architecture can be gained. Time spent developing custom codes and programs can be avoided by using the tool to formulate the data processors nad intercept the flow at any stage to ensure correctness. Finally, the output can be generated into a variety of different data formats, including Microsoft Excel, relational database tables and Elixir Report Designer.
Datasource
What is a data source (DS)? A data source is an object in a report that provides data for displaying the information in the report. A data source contains information about a connection to a database. This includes information such as a server name, database name, table schema (field name) and user credentials. The information contained within a data source varies depending on the type of database and format. Some data source is extensible, allowing developers to create additional data processing extensions to be used to connect to other sources of data.
A data source can be shared by several reports. THe definition for a shared data source is stored in a separate file with the extension .ds. A report can contain one or many data sources.
Below list the different type of data source that are supported in Data Designer.
| Datasource Type | Description |
|---|---|
| Composite | Allows you to design a data flow using various data manipulation components in a network to get a personalised view of the data. |
| Excel | Adds an Excel Datasource that the data can be accessed directly from the Excel file. |
| JDBC | Supports reading of data using JDBC and provides SQL query builder. |
| LDAP | Accesses information directories such as organisations, individuals, phone numbers and addresses. |
| MongoDB | Allows access to data in a MongoDB database. |
| Object | Allows data to be extracted at runtime from Java objects and Enterprise Java Beans. |
| Properties | Provides a single record of data, usually either to a parameters processor or to be used as a direct data source. |
| Tabular | A self-contained data source that is editable from within Elixir Ensemble. |
| Text | Allows access to data from a text file. |
| XML | Allows access to data in an XML file. |
Features
The features of the Elixir Data Designer include:
| Feature | Description |
|---|---|
| Multiple Data Source Support | This tool is capable if manipulating and merging data from many data sources, including custom data sources. Standard data source support includes JDBC, XML, Microsoft Excel, and a variety of text formats. |
| Built-in Filtering | When only a particular subset of data is required, it can be extracted using the Filter processor available in the Composite Designer. More complex filtering can be performed with the help of scripts. |
| Data Derivation | By using the Derivation processor, a new field can be derived by performing operations on the existing columns in the data source. |
| Multiple-dimensional Data Transformation | The OLAP Cube control can be used to perform complex data operations with hierarchies, dimensions and multiple measures using standard operations, such as max, min, count, etc. |
| Caching | The Cache processor is used to cache the data fora specified amount of time so that the user can avoid unnecessary repeated data retrieval from the original source. The related staging feature stores te data temporarily when all the processes are completed. This helps to flush/optimise the memory. |
| Data Output and Loading | The different data store types available in the Elixir Data Designer include XML file, JDBC, Excel file and CSV file. In addition, through the Custom Java DataStore, use-defined stores can be supported. |
Workspace
There are two types of datasource, the basic data source and the composite datasource. Depending on the type of datasource selected in the repository, the workspace will different set of tab/tabs.
When a composite datasource is selected in the repository, three tabs will appear, namely Designer, Script and Data. For a basic datasource, only the Data tab will appear.
Data Workspace
The Data workspace will appear when either a usual datasource or a composite datasource is selected.
In the example below, a basic datasource is selected.
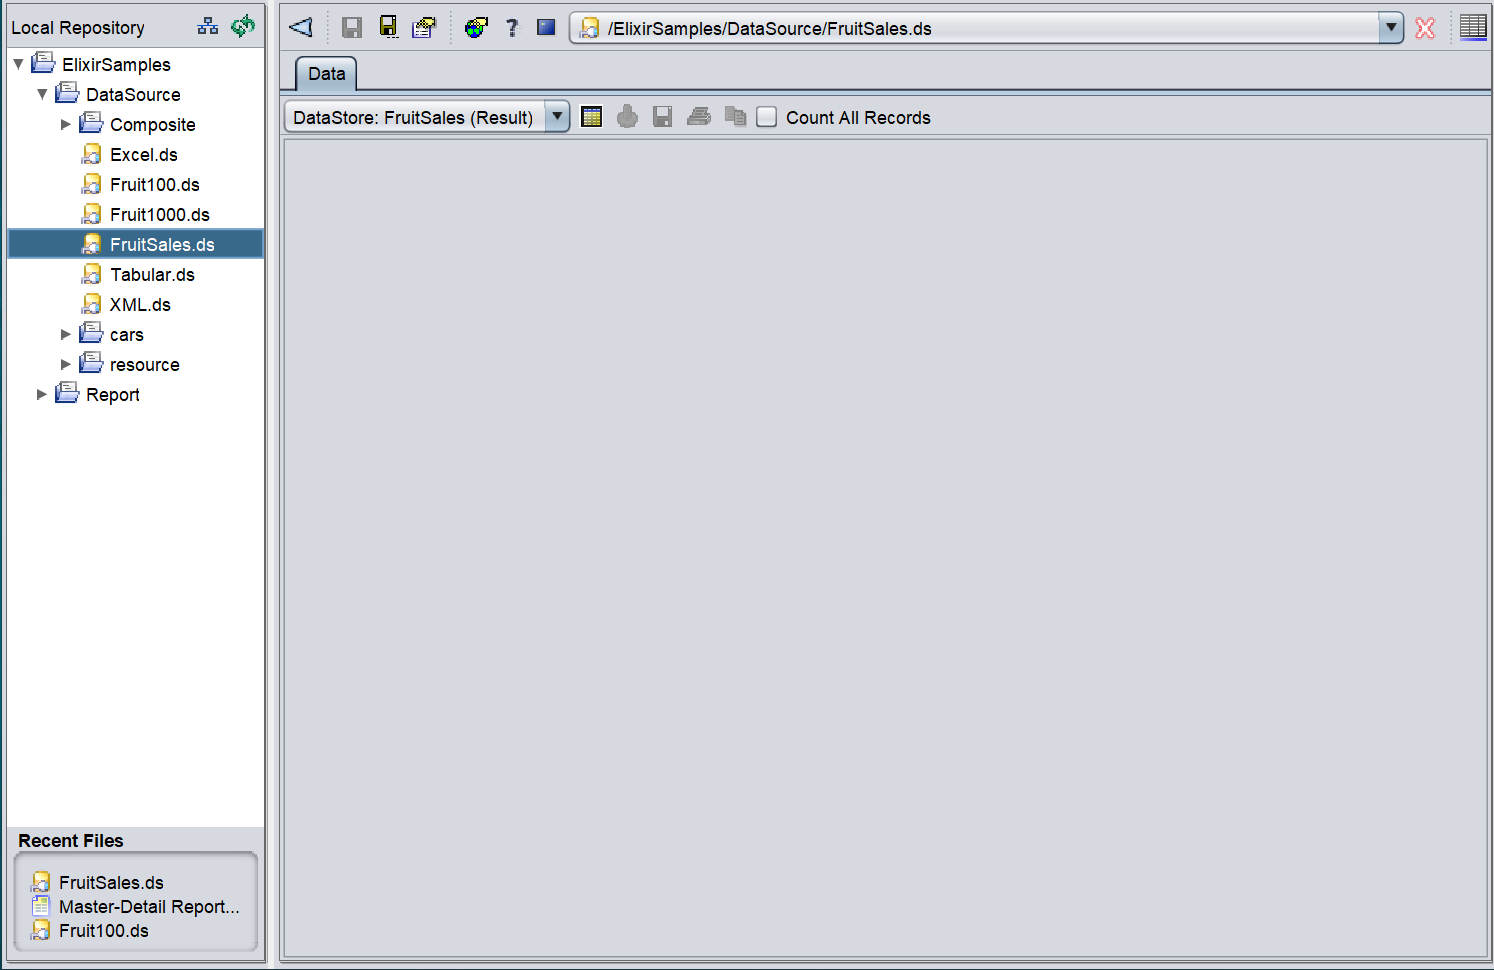
The action icons provides the following functions:

| Function | Description |
|---|---|
| Drop-down list | Displays the name of the selected datasource. |
| Load Data | Initiates the data flow to process the data source records and render the output as a table within this data tab. |
| Save Data | Saves the data in the selected file format. This icon is disabled initially. It is only activated after data has been loaded. |
| Print Data | Prints the data table after the data has been loaded. This icon is disabled initially. It is only activated after data has been loaded. |
| Copy | Copies the selected rows onto clipboard after the data has been loaded. The set of data copied can be pasted into an editor and saved as an XML file. |
| Count All Records | Displays the total number of records present in the data source. By default, the workspace displays up to a maximum of 500 records. On selecting the Count All Records checkbox and clicking the Load Data icon, the total number of records available in the data source is displayed on the top of the workspace. Turning this option on will slow the response for huge data sources as the value can only be obtained after all processing has finished. |
| Generate Data | When clicked, data in the datasource will be generated and displayed. |
The drop-down list on the left displays the datasource selected. By default, except for the “Load Data” icon, all other icons are disabled.
Load Data
When the datasource is initially selected, no data is displayed in the Data tab. To view the data, click on the  “Load Data” icon and the resultant data will be displayed.
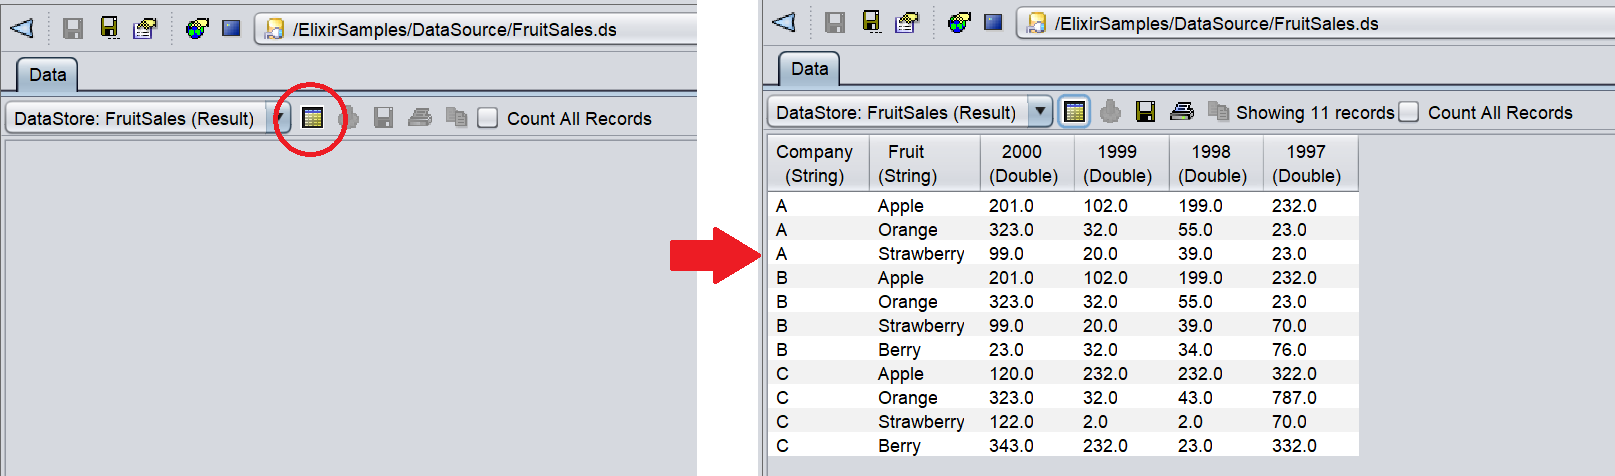
Once the data is loaded onto the Data tab, the number of records in the datasource will be displayed on the left of the “Count All Records” checkbox.
Save Data
When the  “Save Data” icon is clicked, the datasource displayed in the Data tab can be saved as a file in the selected format via a dialog box.
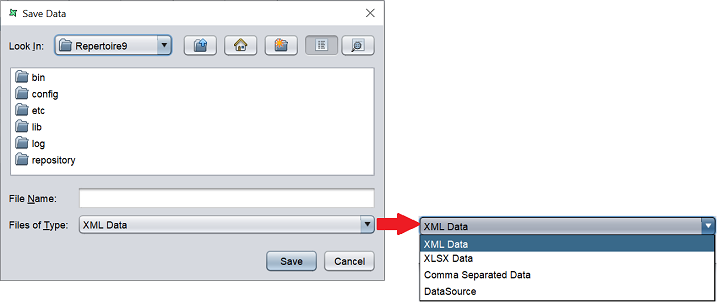
The folder location in the dialog box is the current location of the Repertoire software suite. By default, the files/folders are displayed in the “List” format. There are several icons in the dialog box that allows you to select the location, create new folder or display the file location in other format.
| Icon | Description |
|---|---|
 Up One Level Up One Level |
Goes one level up from the current location. |
 Home Home |
Goes to the “Home” folder. For some system, it may be the “Desktop” folder. |
 Create New Folder Create New Folder |
Creates a new folder in the current location. |
 List List |
Displays the file location in list format. |
 Details Details |
Displays the file location in details format. |
Print Data
This function is disabled initially and is only available when the data has been loaded. It allows you to print the datasource table out as per desired print output (e.g., PDF).
Copy
This function is disabled initially and is only available when the data has been loaded. It allows you to copy the set of data to be pasted into an editor and saved as an XML file.
Count All Records
This function is used to display the total number of records present in the datasource. By default, the data window displays up to a maximum of 500 records. On selecting this function (via checkbox) and clicking on the “Load Data” icon, the total number of records available in the datasource is displayed on the top of the data window. Turning this option in will slow the response for huge datasources as the value can only be obtained after all processing has finished.
Generate Data
This function allows you to generate and display the data in the datsource when clicked.
Composite Data Workspace
The Composite Data Workspace will appear when a composite datasource is selected. Three tabs will appear:
- Designer - Displays the data flow designed
- Script - Displays the JavaScript functions created to enhance the process power of the Elixir Data engine
- Data - Displays the data of the datasource selected
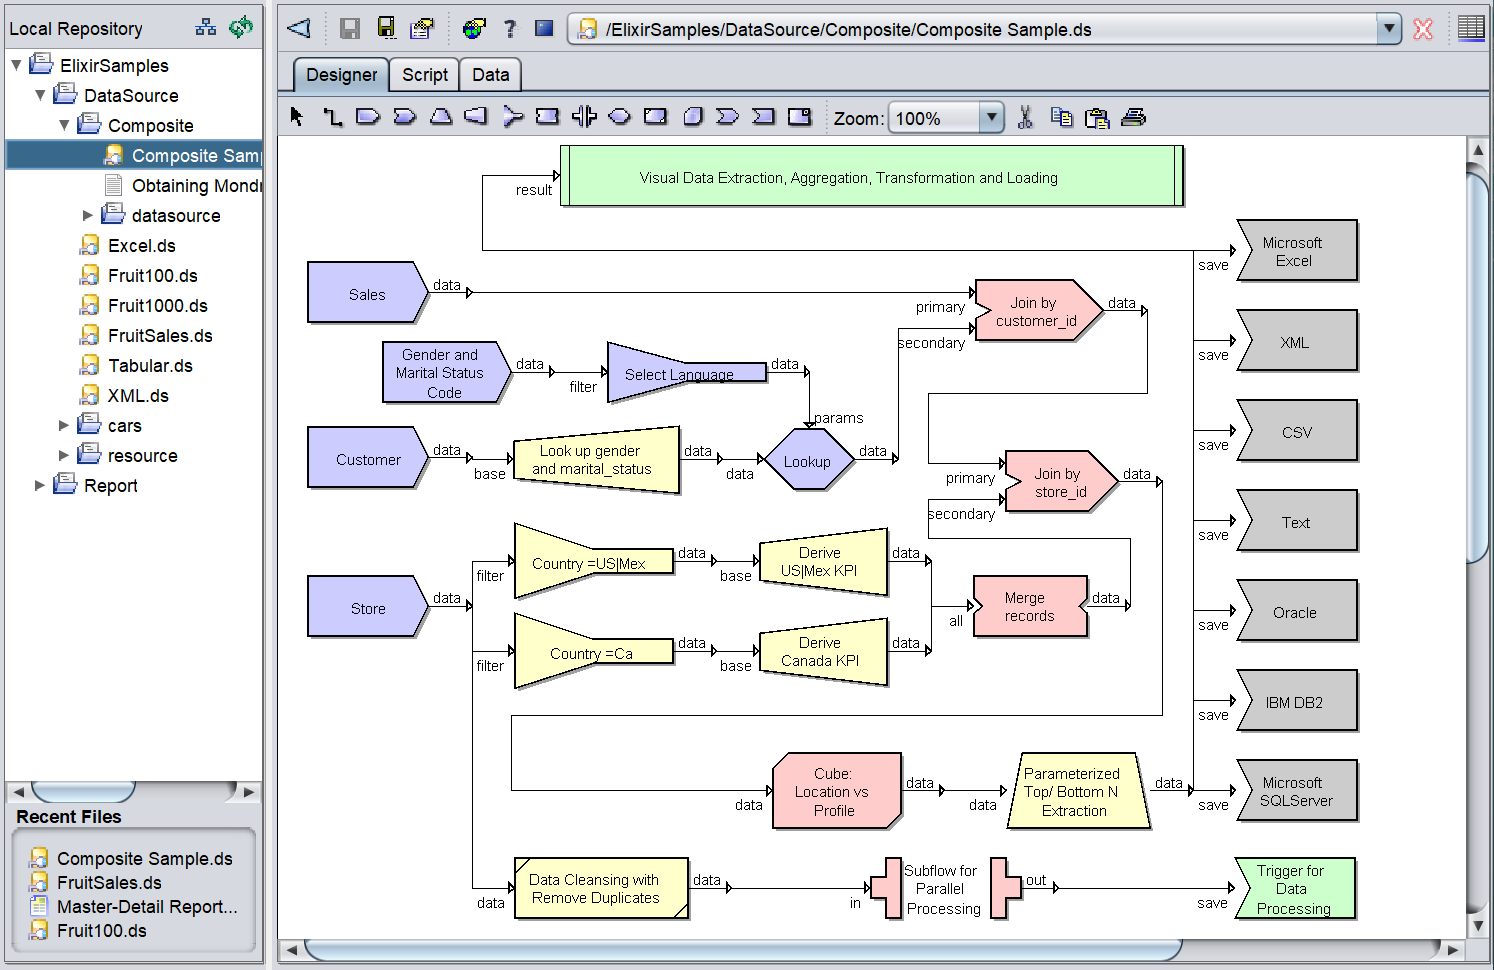
Designer Tab
The Designer tab allows you to design the composite datasource. The Designer workspace consists of two parts:
- Menu Bar
- Designer workspace
Menu Bar
The Menu Bar can be divided into two parts. The front part consists of a list of processors. The second part consists of other functions, such as zoom, cut, copy, paste and print functions.

See Data Operation Processors for more details.
For the other part, the table below tabulates their functions.
| Menu Bar Buttons | Description |
|---|---|
| Zoom | Allows you to zoom in/out of the designer diagram. Default value is 100%. |
| Cut Selection | Removes the selected item in the designer diagram and place it onto clipboard. |
| Copy Selection | Copies the selected item to clipboard. |
| Paste Selection | Paste the item on clipboard onto the designer diagram. |
| Print Diagram | Prints the designer diagram. |
Workspace
The workspace contains the composite diagram that creates the composite datasource.
When a composite datasource is initially created, the “Result” box will appear by default.
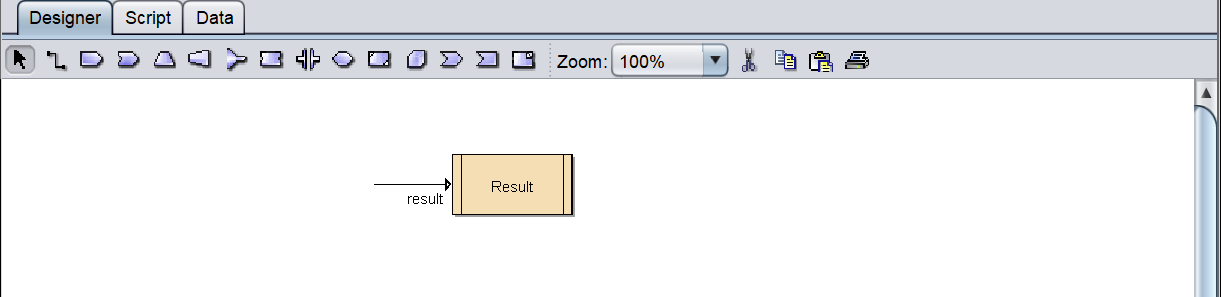
The result of an operation performed in the data designer can be viewed using this graphic. This can be doe by connecting the data output of any processor to the input of the “Result” box. When other tools, such as the Report Designer connect to the data designer, they will use the data provided by “Result”.
Script Tab
Any scripts written in this JavaScript editor will beexecuted once when the composite is about to begin processing. Therefore, this is a good place to define any functions and import any standard JAvaScript libraries that is required throughout the composite flow. All other JavaScript locations, for example, in Derivatives and Filters, etc. will execute for every record that flows through them. It is inefficient to keep defining the same function over and over again, so move the functions themselves into the Script tab and call these functions from the processors as needed.
The Scripts tab consists of several panels.
- Top panel (includes Operations sub-panel)
- Bottom panel which consists of
- Category
- SubCategory
- Feature
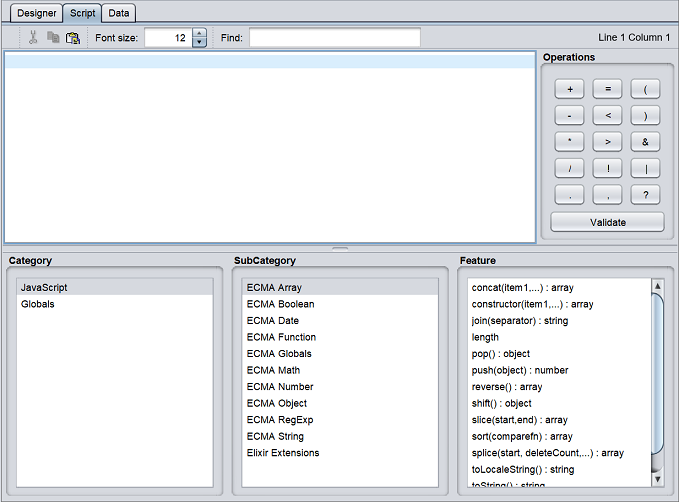
The top panel allows you to define the desired JavaScript for the composite. The Category sub-panel lists all the categories available, which are JavaScript and Globals. The SubSCategory sub-panel lists all the sub-categories based on the selection in Category sub-panel. The Feature sub-panel lists all the features of the sub-category selected (for JavaScript) only.
Double-click on the feature will add the feature onto the top panel. You can then use this feature to write your JavaScript.
For Globals, by default only this is available in the SubCategory. Double-click on it will also add to the top panel.
Data Tab
The Data tab is the same as per normal datasource. See Data Workspace for more details.