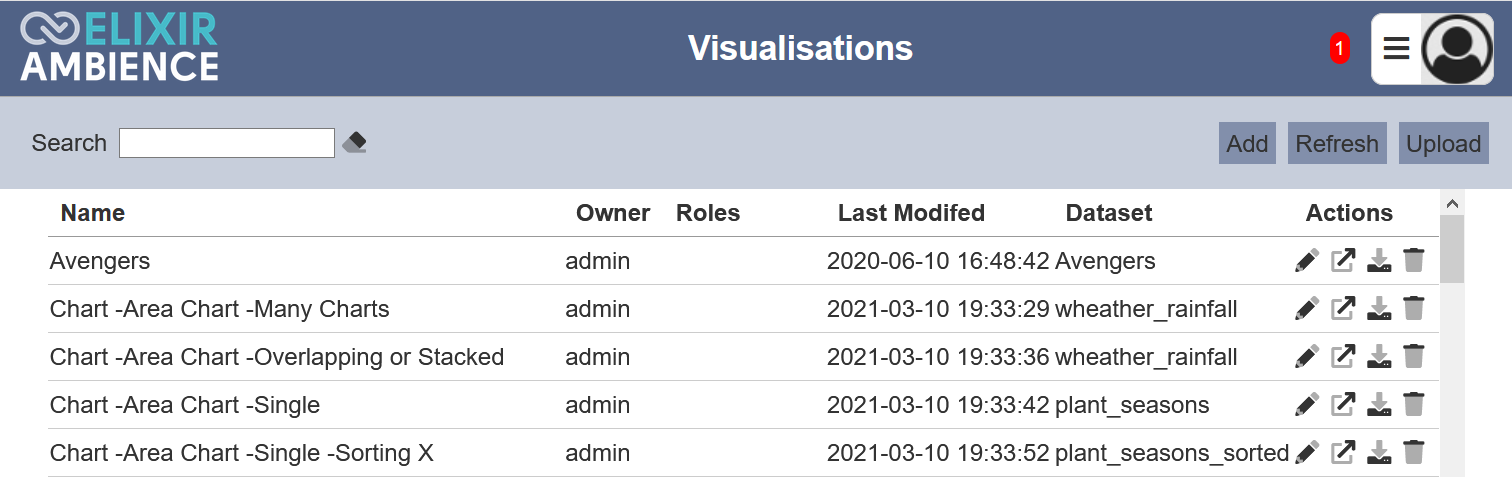
Visualisations
Description
The Visualisations module provides a simple interface to create chart, view or table easily.
Only the owner can access and edit the visualisation.
Module Interfaces
| Interface | Description | Required Privilege |
|---|---|---|
| Visualisations | Allows access to Visualisations page. | mod-viz |
| Visualisations | Allow to edit visualisation metadata. | mod-viz-edit |
| Visualisations | Allows visualisation interactive access. | mod-viz-interactive |
| Visualisations | Allow to edit visualisations. | mod-viz-interactive-edit |
Add Visualisation
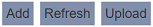
To add a visualisation, click on the “Add” button at the upper right corner of the page.
The “New Visualisation” dialog box will appear.
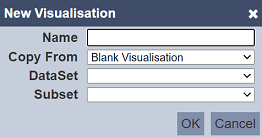
In the “Name” field, key in an unique name for the new visualisation. You can either copy from an existing visualisation from the drop-down list or create a blank visualisation by selecting “Blank Visualisation” in the “Copy From” field. Select a dataset from the drop-down list in the “DataSet” field. In the “Subset” field, select a subset from the drop-down list (optional). Click on the “OK” button to create the new visualisation or click on the “Cancel” button to abort the action.
Upon successful creation, the Visualisation Designer page will appear.
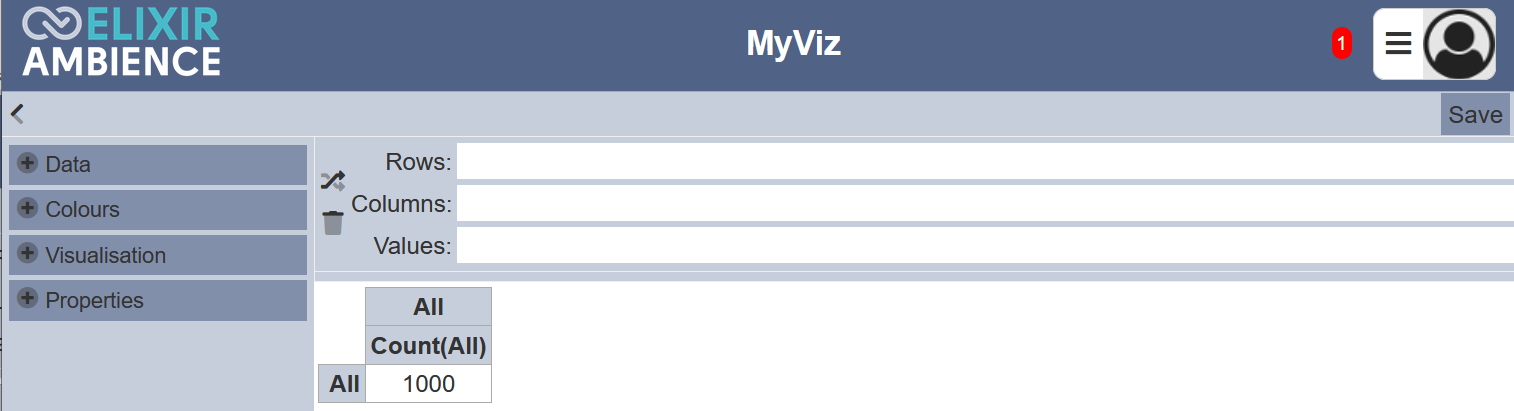
Refer to Visualisation Designer for more information.
Refresh Page
After performing actions on the browser/tab, the list is reloaded to display the list of visualisations. The manual “Refresh” button is available and is particularly useful if you have opened multiple pages and are making changes in these pages.
The “Refresh” button is found on the upper right corner of the page. Clicking on it reloads the list of visualisations.
Upload Visualisation
To upload a visualisation, start by clicking on the “Upload” button on the upper right corner of the page.
The “Upload” dialog box will appear.
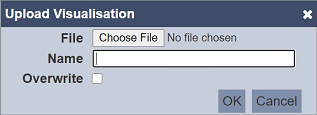
Browse to the location of the visualisation JSON (.json) file to be uploaded and key in an unique name in the “Name” field. If the visualisation to be uploaded is to replace an existing visualisation, select the “Overwrite” field. Click on the “OK” button to upload the visualisation. Click on the “Cancel” button to aborts the action.
Upon successful uploading, a message will appear.
Edit Visualisation
This feature allows you edit the properties of the visualisation, as well as the roles who can access the visualisation. To edit the visualisation, click on the  “Edit” icon under the “Actions” column corresponding to the desired visualisation.
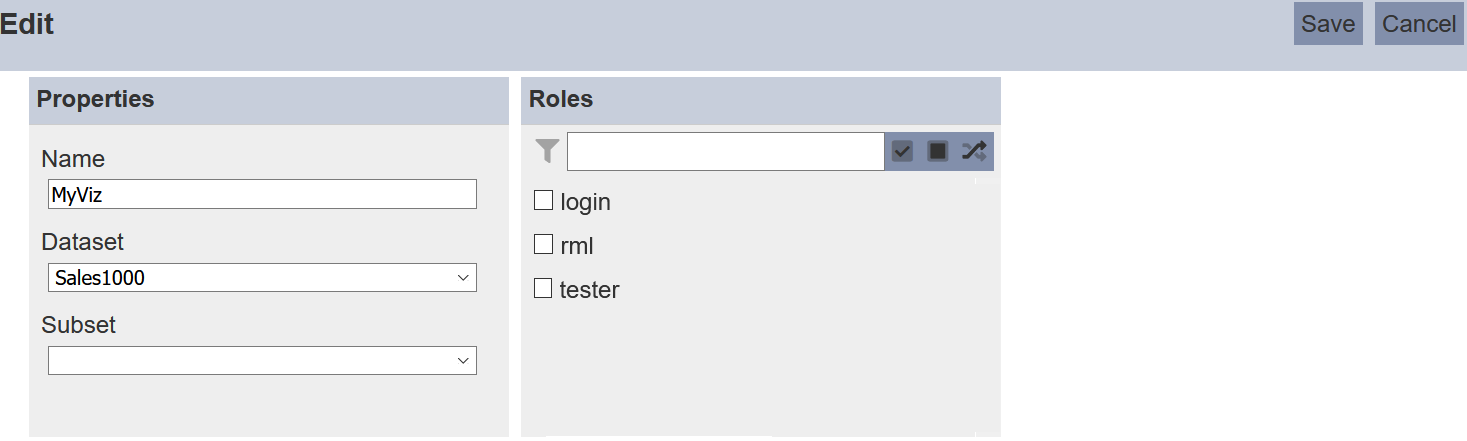
The “Edit” panel will appear. In the “Properties” panel, you can edit the name, dataset and subset of the visualisation. Do note that the name need to be unique.
In the “Roles” panel, you can select the Roles that can have access to the visualisation. Alternatively, you can search for the desired role by keying in the keyword in the search function at the top of the panel. You can also choose to select all, select none or invert selection by clicking on their respective icons on the right of the search function.
Click on the “Save” button to save the changes. Clicking on the “Cancel” button aborts the action.
Open Visualisation
To open a visualisation allows you to edit the metadata of the visualisation. You need to have the mod-viz-interactive-edit privilege to do so.
Click on the  “Edit” icon under the “Actions” column corresponding to the desired visualisation.

The Visualisation Designer page will appear.
Refer to Visualisation Designer for more information.
Download Visualisation
To download a visualisation, click on the  “Download” icon under the “Actions” column corresponding to the desired visualisation.
The downloaded visualisation has a filename format of <filename>.visualisation.json.
Delete Visualisation
To delete a visualisation, click on the  “Delete” icon under the “Actions” column corresponding the desired visualisation.
There is an option to undo the deletion. A notification with an “Undo” button appears right after clicking on the “Delete” icon.
Upon clicking on the “Undo” button, the deleted visualisation is restored and is added back to the list of visualisations.
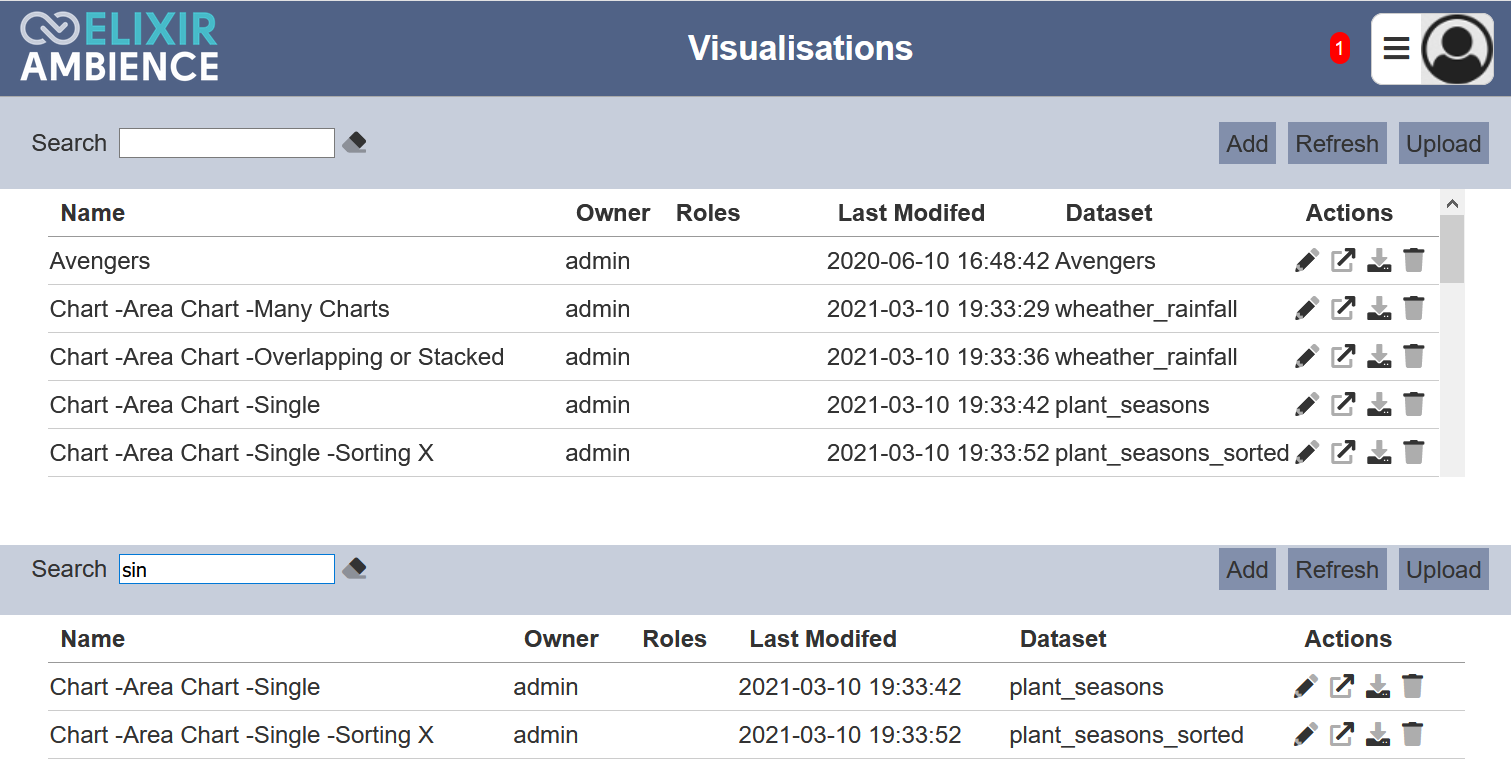
Search
There is a cross-field search function for the list of visualisations. It is located at the upper left corner of the page.
This provides an easy way to search through the visualisation list. It is case-insensitive and display visualisations that have the entered search value in any of the values of the fields below:
- Name
- Owner
- Last Modified