
Org Chart (2025.1)
Description
The Org Chart module allows users to construct hierarchies - tree structures such as organisation charts, project phases and also link them to ETL steps and vice versa to allow functions, such as querying a hierarchy to find an employee’s superior for escalation.
The Org Chart module is integrated with the Data Catalog module so that you can construct directed trees of any kind. The ability to define multiple hierarchies with the same nodes allows cross-cutting concerns to be modelled (a series of trees is effectively a matrix).
Use
Let’s examine how we can use Org Chart to model a common scenario. For example, a project has phase1, phase2, phase3 (one hierarchy Project->Phase) the team have different roles, developer, QA, business analyst (another hierarchy Skill->Person) and then the staff assignments to each phase (multiple hierarchies, one per phase, Phase->Person). You may also have a reporting hierarchy (Person->Person). Each tree is a series of one-to-many relationships. Together these hierarchies make a single “Org Chart” where the same nodes (Project,Phase,Skill,Person) have been reused across multiple trees to show different hierarchical relationships.
The key to modelling using hierarchies is to realise you can’t put Project->Phase->Person on a single hierarchy, if you want to use the same person across multiple phases. That is no longer a tree (because a person would need multiple “parent” phases). To model the real world with trees, we make each Phase a separate hierarchy, so the same user can be seen on each. This allows us to query: “is person X involved in phase2”.
You should start by modelling the data types in the Data Catalog (Project, Phase, Skill, Person) and then create an Org Chart with multiple hierarchies to define instances of these types and the relationships between the instances.
Maintaining trees is usually a lot simpler and easier to visualise effectively compared to managing a complex graph of interconnected “spaghetti” relationships on a single diagram. It also allows for more focused ETL queries to obtain the necessary data for decision making.
Module Interface
| Interface | Description | Required Privilege |
|---|---|---|
| Org Chart | Allows access to Org Chart page. | mod-org-charts |
| Org Chart Designer | Allows access to Org Chart Designer page. | mod-org-chart |
Add
This function allows you to add a new organisation chart.
To add a new chart, click on the “Add” button at the upper right corner of the page. The “Create New Org Chart” dialog box will appear.
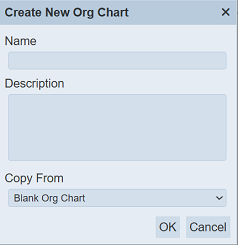
Key in a unique name for the new chart in the “Name” field. In the “Description” field, provide a brief description for the new organisation chart. In the “Copy From” field, you can select either a blank chart or copy from an existing chart from the drop-down list. Click on the “OK” button to add the new chart. Click on the “Cancel” button to abort the action. If the name of the chart already exist, an error message will appear.

Once the new chart has been added, the Chart Designer page will appear.
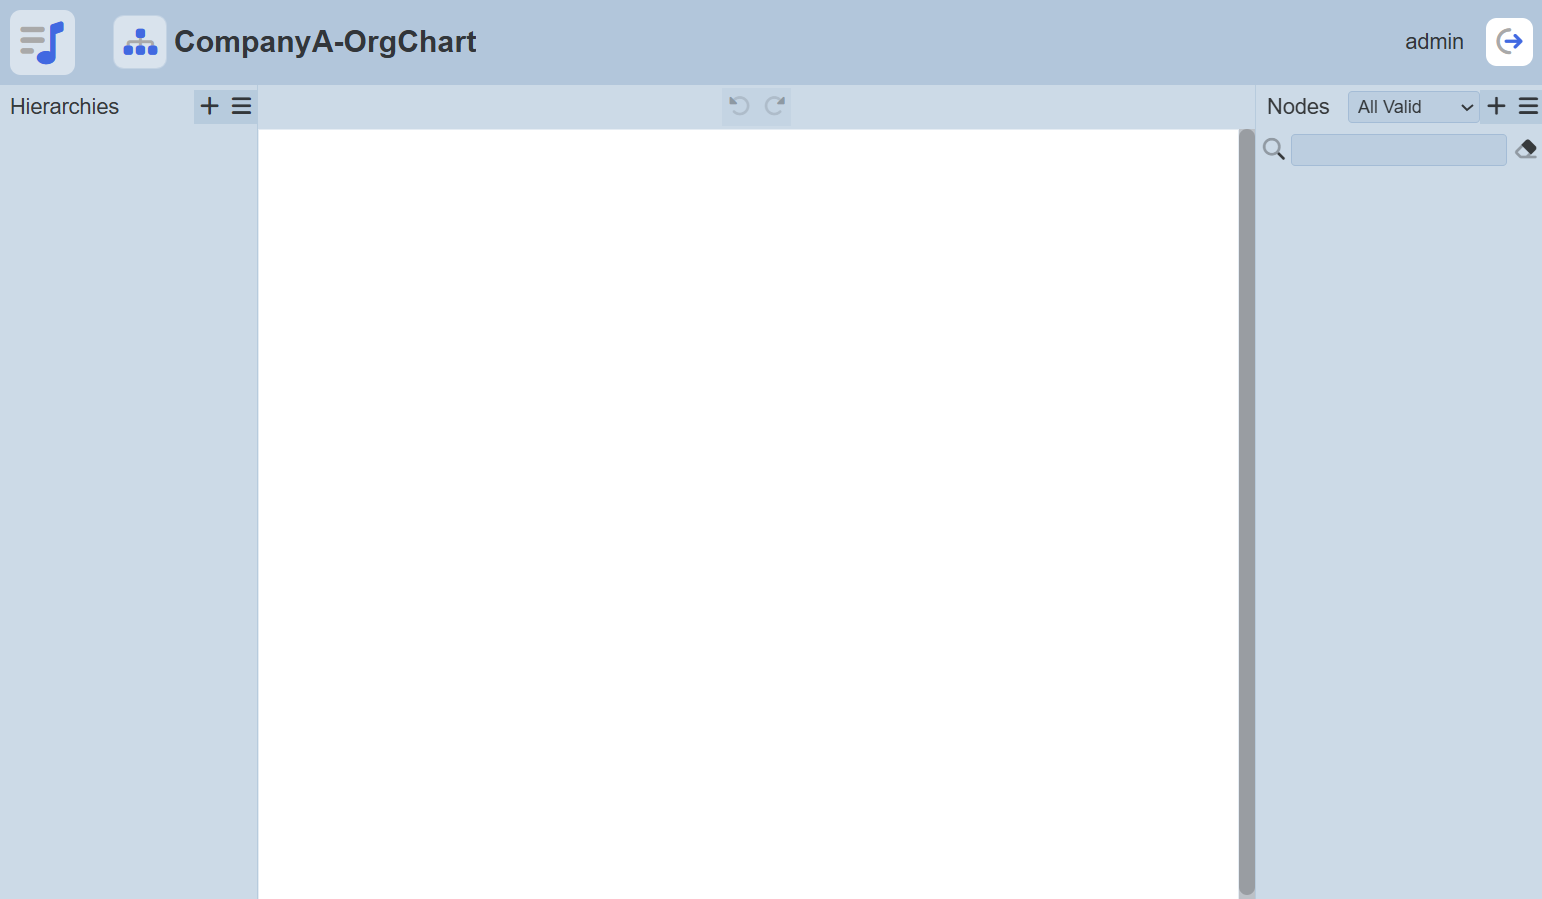
Refer to Chart Designer for more details. To return to the Org Chart Management page, click on the Org Chart icon ![]() at the top of the page.
at the top of the page.
Refresh
After performing actions on the browser/tab, the list is reloaded to display the list of charts. The manual “Refresh” button is available and is particularly useful if there are others making changes on the same page.
The “Refresh” button is found on the upper right corner of the page. Clicking on it reloads the list.
Upload
This function allows you to upload an existing organisation chart onto the Org Chart management page.
To upload a chart, click on the “Upload” button at the upper right corner of the page.
The “Upload” dialog box will appear.
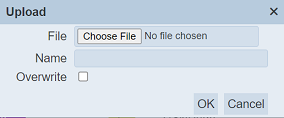
Single File
Browse to the location of the chart to be uploaded (<filename>.org-chart.json). The “Name” field uses the filename of the file selected by default. You can change the name as desired, then click on the “OK” button to upload the chart. If the chart already exist, an error message will appear.
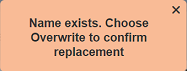
If the chart to be uploaded is to overwrite an existing chart, select the “Overwrite” field before clicking on the “OK” button.
Once the chart is uploaded successfully, a notification will appear.

Zip File
Browse to the location of the zip file to be uploaded. The name of the layouts will be extracted from the zip file. Click on the “OK” button to upload the layouts. The “Upload Results” dialog box will display the results of the uploading.
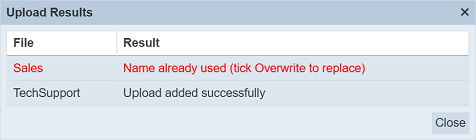
Those results in black are uploaded successfully while those in red indicates upload failures with their relevant messages. Click on the “Close” button to close the dialog box.
Edit
This function allows you to edit the properties of the chart, such as name and description of the chart, and to enable or disable the chart.
To edit a chart, click on the  “Edit” icon under the “Actions” column corresponding the desired chart.

The “Edit Org Chart Properties” dialog box will appear.
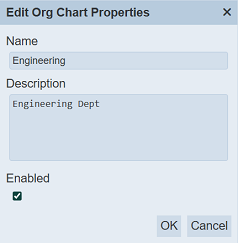
Edit the name and/or description of the chart as desired The name must be unique or an error message will appear. You can also enable or disable the chart by selecting or de-selecting the “Enabled” field.
To save the changes, click on the “OK” button on the upper right corner of the dialog box. To abort the action, click on the “Cancel” button.
Open Chart Designer
The Chart Designer allows you to edit existing chart.
To open the Chart Designer, click on the name of the desired chart under the “Name” column. The “Chart Designer” page will appear.
Refer to Chart Designer for more details.
More Actions
This feature allows user to perform actions on multiple charts at the same time.
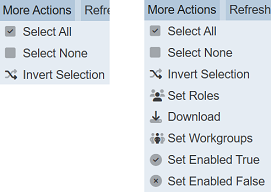
When the “More Actions” button located at the upper right corner of the page is clicked, a list of available actions are displayed.
If no layout is selected prior clicking the button, there will be fewer actions available. To select a layout, select the checkbox next to the name of the layout.
| Option | Description |
|---|---|
| Select All | Selects all charts in the list. |
| Select None | Unselects all charts. |
| Invert Selection | Inverts the current selection. That is, any charts selected will be unselected and vice versa. |
| Set Roles | Selects the roles to be assigned to the charts. |
| Download | Downloads multiple charts as a zip file. If only one chart is selected, the selected chart will be downloaded as a JSON file. |
| Set Workgroups | Selects the workgroup to be assigned to the charts. |
| Set Enabled True | When selected, sets the selected charts to enable. |
| Set Enabled False | When selected, sets the selected charts to disable. |
Set Roles
To set the roles for the selected charts, click on the “More Actions” button and select the “Set Roles” option. The “Set Roles” dialog box will appear.
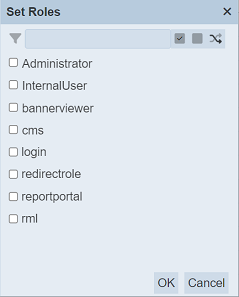
Select the roles to have access to the charts by selecting the checkboxes. Alternatively, you can search for the desired role by keying in the keyword in the search function at the top of the dialog box. You can also choose to select all, select none or invert selection by clicking on their respective icons on the right of the search function.
Click on the “OK” button to save the changes or click on the “Cancel” button to abort the action.
Download
To download the selected charts, click on the “More Actions” button and select the “Download” option.
If only one chart is selected, the downloaded chart has a filename of <filename>.org-chart.json.
If more than one chart are selected prior, the “Download” dialog box will appear.
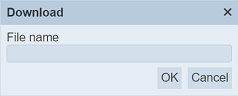
Key in the desired name for the zip file and click on the “OK” button. The selected charts will be downloaded as a zip file with the filename provided earlier. The individual chart in the zip file will have the filename format as mentioned above.
Set Workgroups
To set the workgroups to be associated with the selected charts, click on the “More Actions” button and select the “Set Workgroups” option. The “Set Workgroups” dialog box will appear.
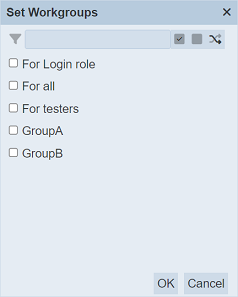
Select the workgroups to be associated with the chart by selecting the checkboxes. Alternatively, you can search for the desired workgroup by keying in the keyword in the search function at the top of the dialog box. You can also choose to select all, select none or invert selection by clicking on their respective icons on the right of the search function.
Click on the “OK” button to save the changes or click on the “Cancel” button to abort the action.
Set Enabled True / False
To enable or disable the charts, click on the “More Actions” button and select the “Set Enabled True” or “Set Enabled False” option respectively.
The selected charts will be enabled or disabled as selected.
An enabled chart is represented with a green tick under the “Enabled” column, while a disabled chart is represented with a red cross.
Delete
This function allows you to delete a chart from the Org Chart page.
To do so, click on the  “Delete” icon under the “Actions” column corresponding the desired chart.
There is an option to undo the deletion. A notification with an “Undo” button appears right after clicking on the “Delete” icon.
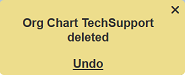
Upon clicking on the “Undo” button, the deleted chart is restored and is added back to the list of charts. Do note that the notification will disappear after a few seconds.
Workgroup
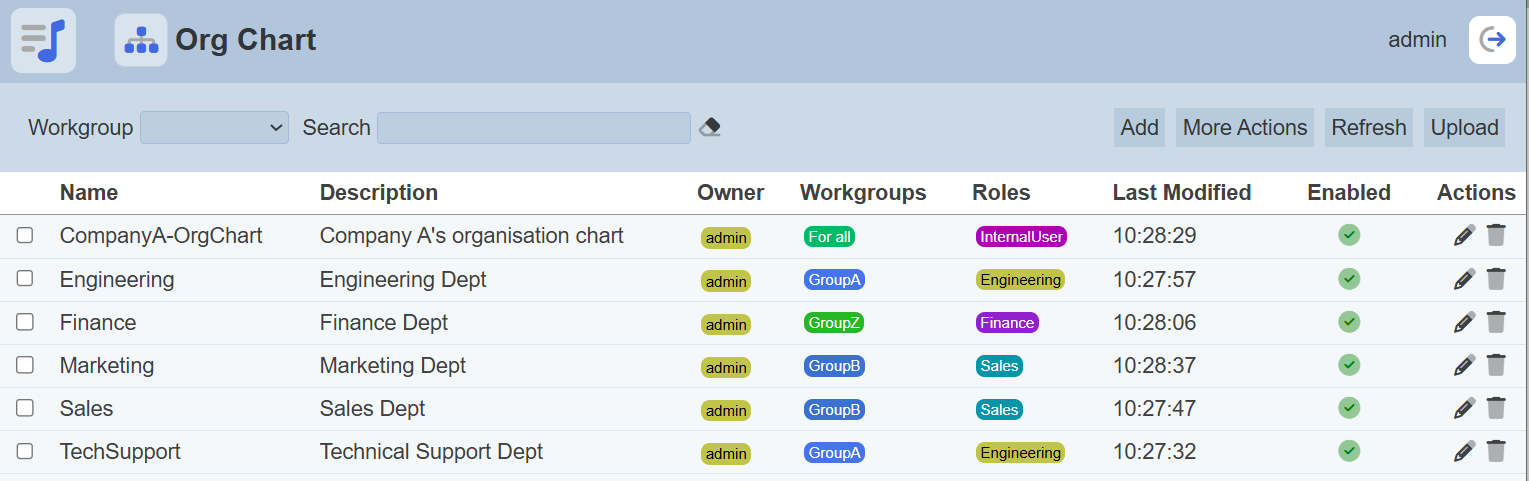
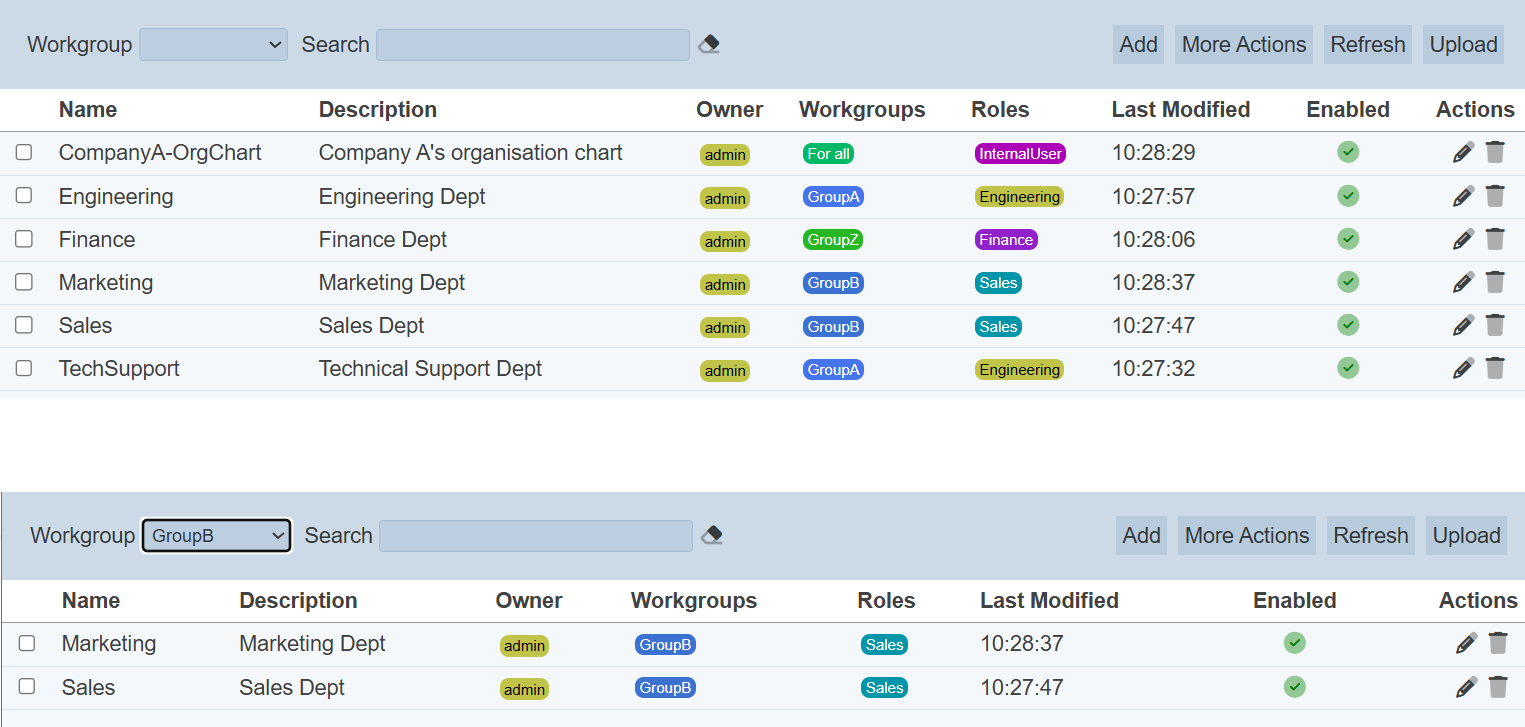
The “Workgroup” field at the top left corner of the page allows you to filter the organisation charts associated with the selected workgroup.
Simply select the desired workgroup from the drop-down list and the chart associated with the selected workgroup will be displayed.
Do note that if no workgroup is created in the Workgroups module, the “Workgroup” field at the top left of the page will not appear.
Search
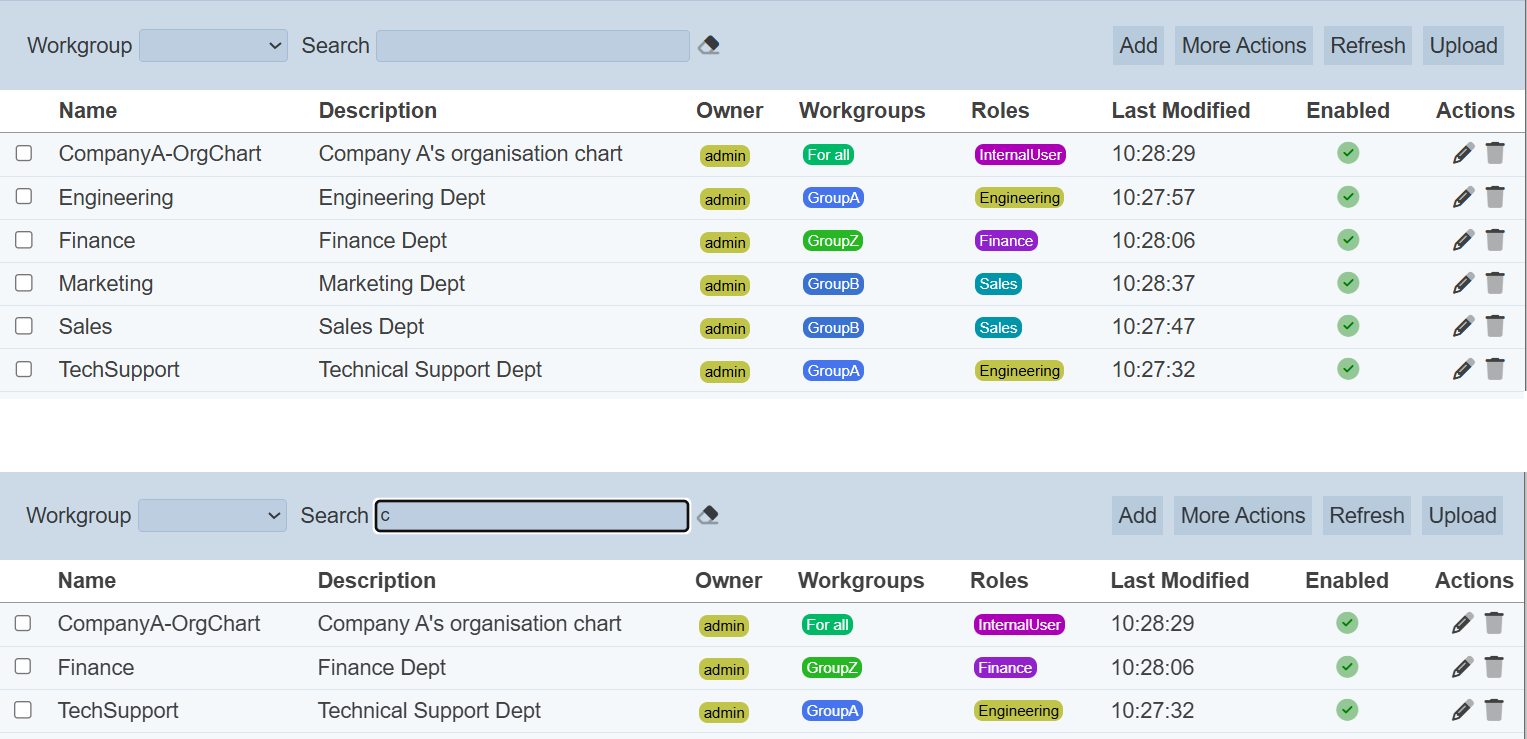
There is a cross-field search function for the list of charts. It is located at the upper left corner of the page.

This provides an easy way to search through the charts. It is case-insensitive and displays files that have the entered search value in any of the values of the fields below:
- Name
- Description
- Owner
- Workgroups
- Roles
- Last Modified
Alternatively, you can click on the any role, workgroup or owner under their respective columns to aid the search for the records in the page.
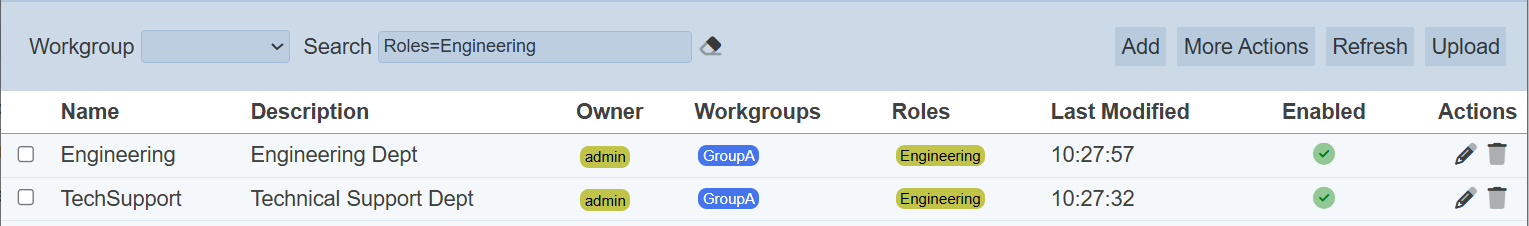
In the example above, charts that are assigned the role “Engineering” are shown.
These two search methods can be combined together, with each criteria separated by a comma.