- Save the .shp and .dbf files in a repository location where all users of the map will have read access to them.
Note
-
In order for the map to render successfully,
- The shapefiles must be kept together in the same folder.
- The naming of .shp and .dbf files must be the same.
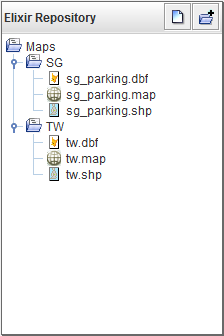
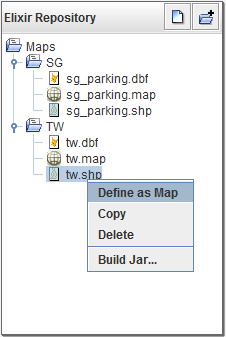
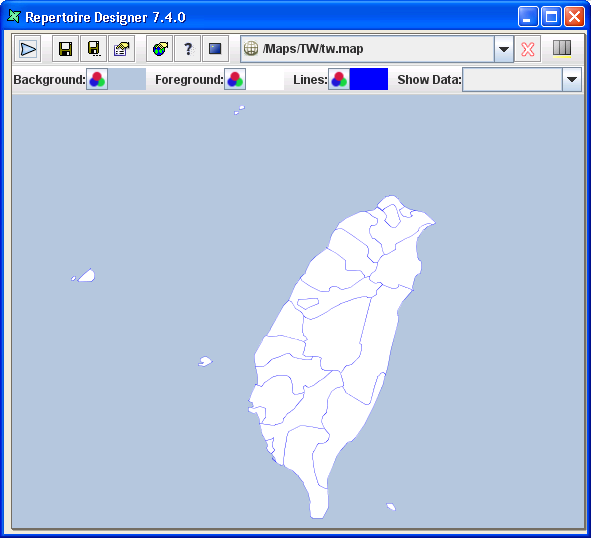
Select the .shp file that will form the background of your map, right-click and select
Define As Map.A default .map file will be created and displayed in the Elixir Workspace as shown in Figure 6.3, “Display default .map file”.
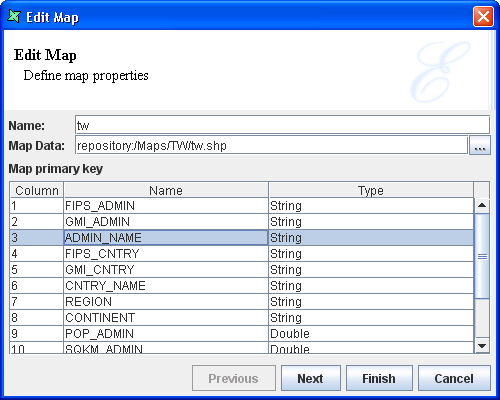
Select the .map file and right-click to select
Open Properties-
Select an appropriate Primary key
and click
Next.
Tip
Why is ADMIN_NAME a more appropriate primary key?If the base map has many regions, it may be a better choice to show as a hovering legend when the cursor is placed over each region.
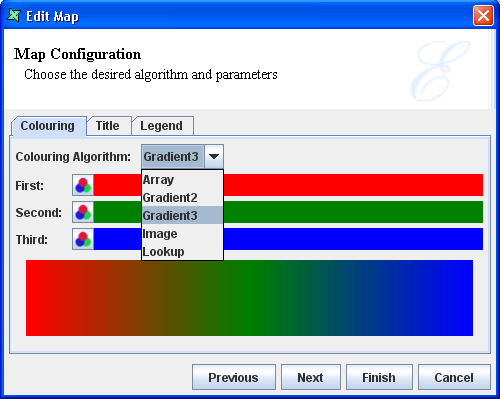
You will see the Map Configuration page is where user can customise the appearance of the map.
Under the
Colouringtab, select the type of colouring algorithm desired for the respective regions of the map.Under the
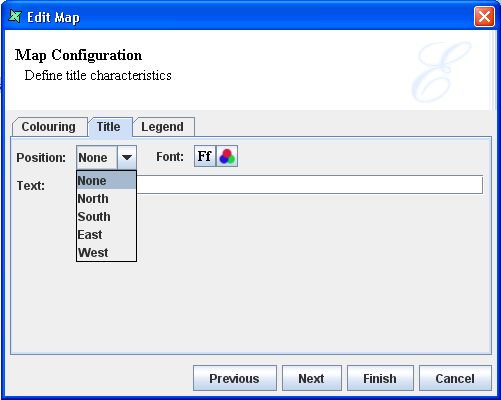
TitleTab,- Text option : (Optional) Enter a title that will appear on your map.
- Font option : (Optional) Select the size and colour of the title.
- Position option : (Optional) Place the title at the top (north), bottom (south), east (right) or west (left) of the map.
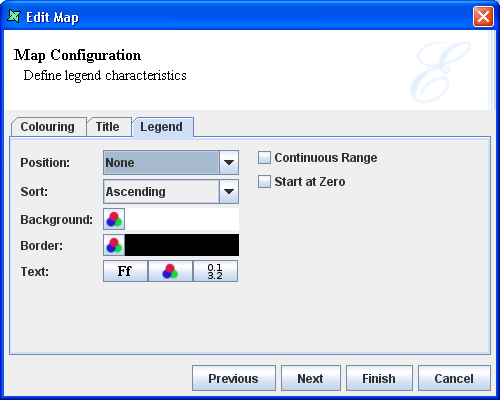
Under the
LegendTab, select the characteristics of the map legend.
Tip
-
If you select
None, user still be able to see a tooltip based on the map primary key when hovering the mouse cursor over a particular region. -
If there is handful of coloured regions on the map, user can consider showing
colours derived from numeric data, you should consider by enabling the
Continuousoption (refer to Legend)
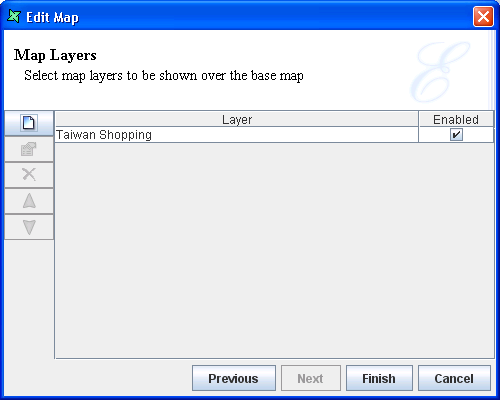
If you have Map Layers
that you wish to add on to the base map, they can be configured here.
If not, click on Finish button to complete the creation
process.
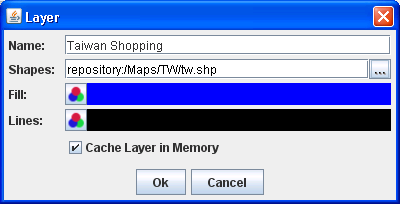
Click the
Addicon and enter the details as follows:- Name option : Enter a meaningful name for the map layer.
- Shapes option : (As an example shown in Figure 6.8, “Format Map Layer”) Enter the URL of the shapefile, for example, repository:/MyMaps/Taiwan/tw_shoppingmalls.shp .
- Fill option : (Optional) Select the colour to appear in the area of the map layer.
- Line option : (Optional) Select the colour for the outline of map layer, which is especially useful when representing railroad or highway routes which are usually represented by lines.
Tip
User can select the layer map .shp file and selectCopyto store the location path to the clipboard in order to paste it under theShapesoption.When a map layer is added, check the check box to enable the map layer to appear as an overlay on the base map, as shown in Figure 6.9, “Enable Map Layer”. User can click on the
Editicon to modify the earlier configurations if necessary.
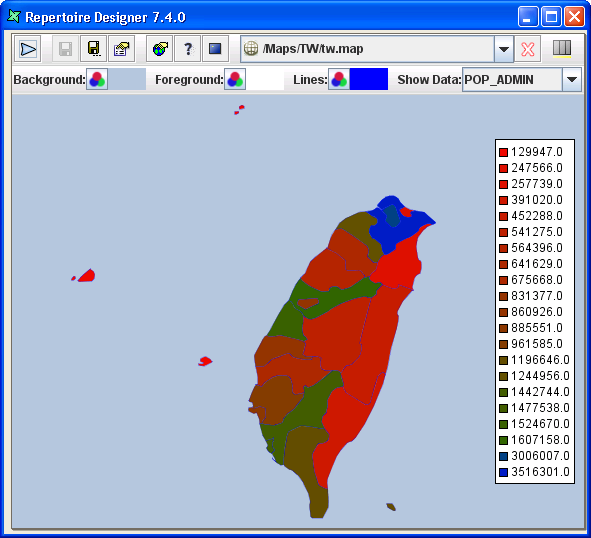
If the base map has “fill-regions” data and a particular Colouring Algorithm has already been setup, user can now preview the map with data.
Drag a datasource (the base map .ds file is a good place to start) to anywhere within the Map view and drop it. This is to populate
Show Data:with the data from the .ds file.Select the field name in the drop down list to activate the Colouring Algorithm type chosen. The result will be similar to Figure 6.10, “Map After Show Data”.
Tip
If a “text” legend is required, user can use GMI_ADMIN as the next best option to describe all regions on the map.
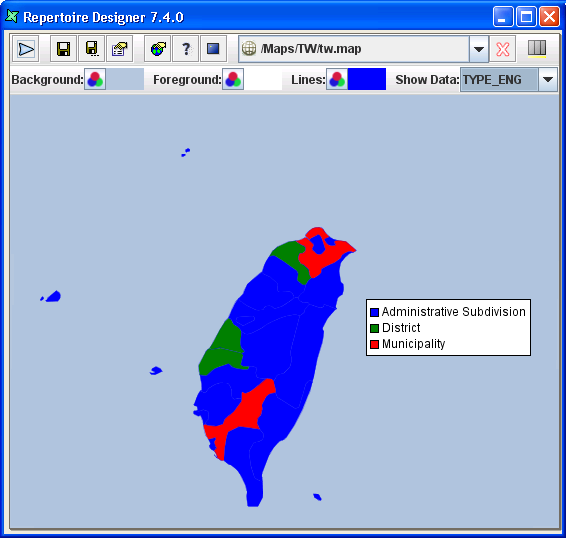
When the mouse cursor hovers over any one region, the region's name will appear, as seen in Figure 6.10, “Map After Show Data”. User can select any field name to experiment how the map will appear with each selection.
Tip
In this example, an interesting field name, TYPE_ENG, shows a group of regions under a specific category. Thus, when selecting this field name, user can see that a number of regions are classified under the same colouring tone instead. In this case,
Legendis best used to display in order to identify all the categories for each region.Note
GMI_ADMIN and TYPE_ENG are common field names found in many .dbf files. There are also some .dbf files which do not have such field names or have the same data with different field names.On the top of Elixir Workspace, there are optional formatting tools to help further to enhance the image of your map.
- Background option : Select the colour to appear outside the base map area.
- Foreground option : Select the colour to appear inside the base map area.
- Lines option : Select the colour for the outline of the regions
Tip
- The foreground colour is useful for specifying regions which do not have "fill-regions" data in the .ds file. It helps to contrast the rest of the coloured regions.
- It is also useful for a base map whose purpose is to show map layers clearly. Thus, the foreground colour should be one that can bring out the clarity of the points on the base map. (Refer to the section called “Map Layers”).