Form and Dashboard Integration
In this example, a form with dashboard views are updated according to the selection in the form.
It consists of two parts and it involves the Dashboards and Forms modules. The first part involves creating dashboard with two views, a pie chart and a linear table. In the second part, we will create a form that includes the dashboard.
Create Dashboard
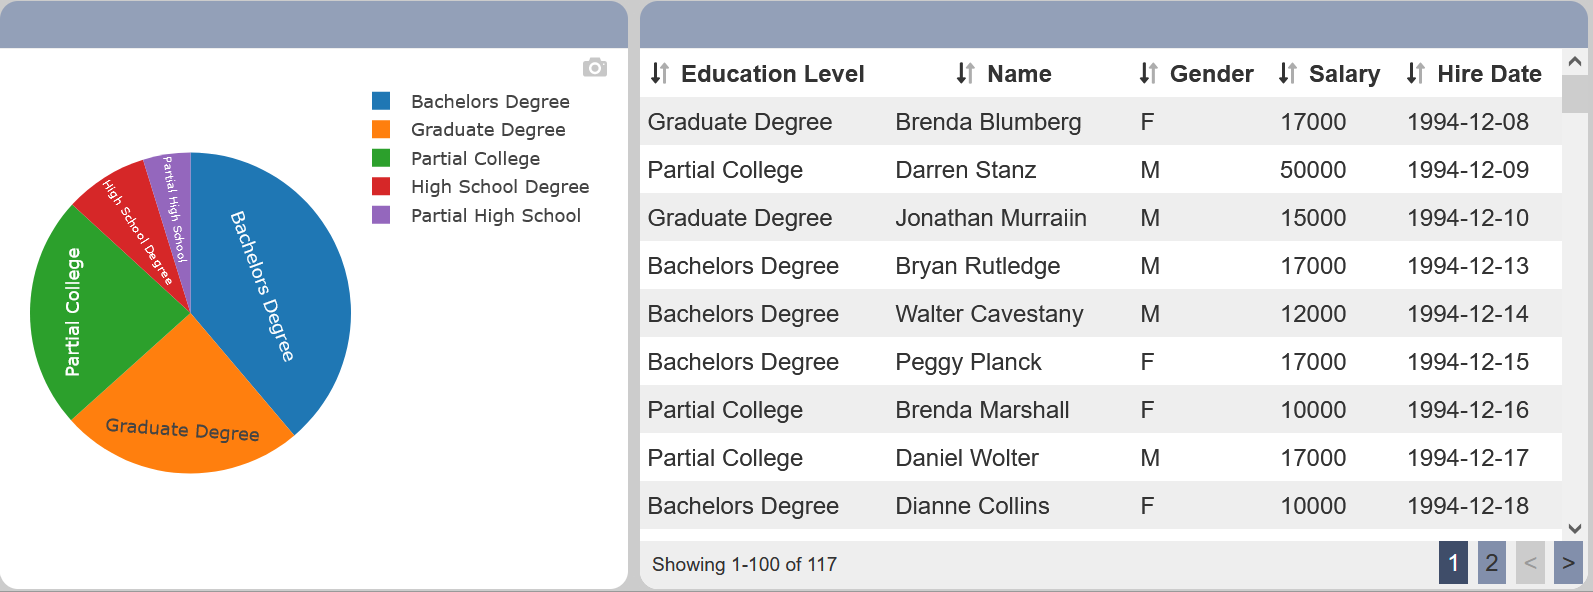
In the Dashboards module, create a dashboard with two views, a pie chart and a linear table.
Create a “Education Level” Select Filter to filter education level.
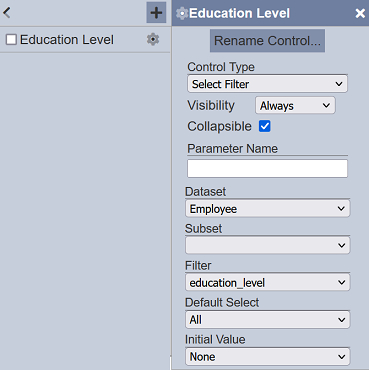
In the “Select to Control” field of the pie chart, select “Education Level”. In the “Controlled By” field of the linear table, select “Education Level”. Save the dashboard. Do note that this filter control is not required. It is created to allow you to see the behaviour more clearly. The “Select to Control” is done through the form.
Create Form
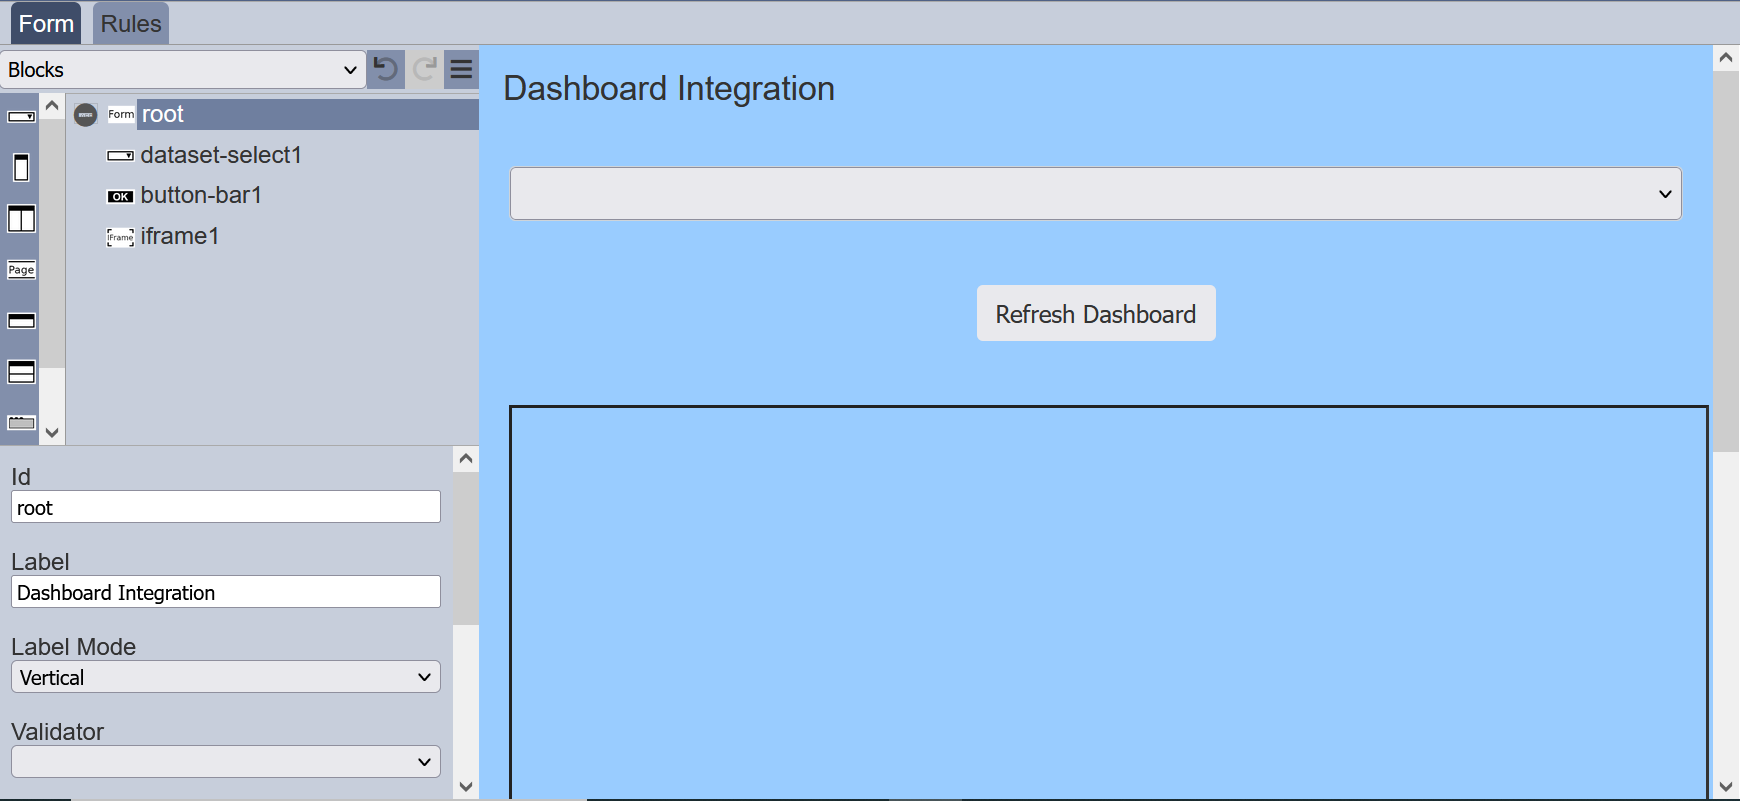
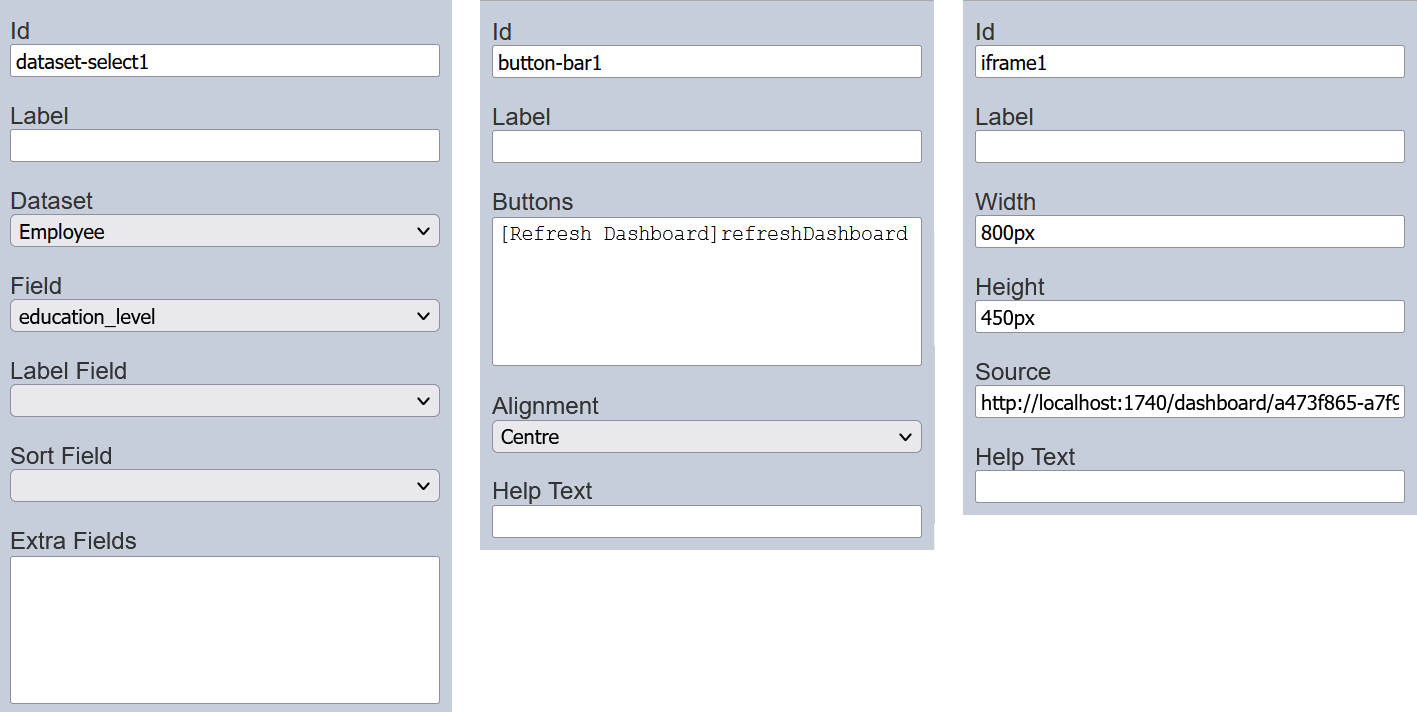
In the Forms module, create a new form with three components; a Dataset Select, a Button Bar and lastly an iFrame component.
Setup Components
In the Dataset Select component, select the same dataset used in the dashboard views in the “Dataset” property and select the same filter field used in the Select Filter control in the “Field” property.
In the Button Bar component, rename the “Buttons” property as [Refresh Dashboard]refreshDashboard.
In the iFrame component, copy the link of the dashboard into the “Source” property. Do note the
Setup Root
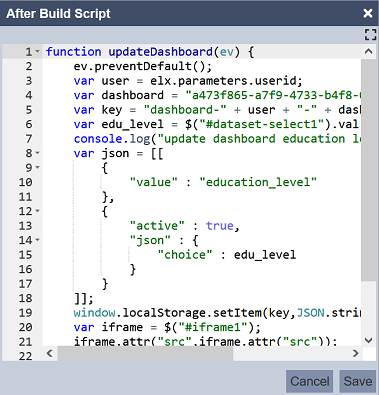
Below is the code for the “After Build Script” property. This script works similar to the “Select to Control” in the dashboard pie chart.
function updateDashboard(ev) {
   ev.preventDefault();
   var user = elx.parameters.userid;
   var dashboard = "<dashboard id>";
   var key = "dashboard-" + user + "-" + dashboard;
   var region = $("#dataset-select1").val();
   console.log("update dashboard region = " + region);
   var josn = [[
      {
         "value" : "Region"
      },
      {
         "active" : true,
         "json" : {
            "choice" : region
         }
      }
   ]];
   window.localStorage.setItem(key,JSON.stringify(json));
   var iframe = $("#iframe1");
   iframe.attr("src",iframe.attr("src"));
   return false;
}

$("#button-bar1-refreshDashboard").off().on("click",udateDashboard);
The first two lines of the script prevents default submit. which means this from can be run without a round-trip to the server. improving efficiency.
The next three lines (line 3 to 5) allow you to update the local storage of the dashboard using these variables. The dashboard stores “mementos” to remember the current filter values between refreshes.
Line 6 gets the current value of the dataset-select1 and call it region. Line 7 writes to the console for debugging.
Line 8 to Line 18 constructs the new set of mementos for the dashboard and edits the content. Do note that “all” mementos will need to be set. If only some values are to be updated, those values need to be read out, modified and placed back.
The next line (Line 19) writes the string (json) defined earlier into the storage.
Finally, Line 20 to Line 22 forces the iFrame to reload with the new filter settings. No explicit round-trip to the server is required.
The last line defines when to call this updateDashboard function. Any other registered event handlers are turned off in the “refreshDashboard” button and our handler is added so that clicking on the button calls the updateDashboard function.
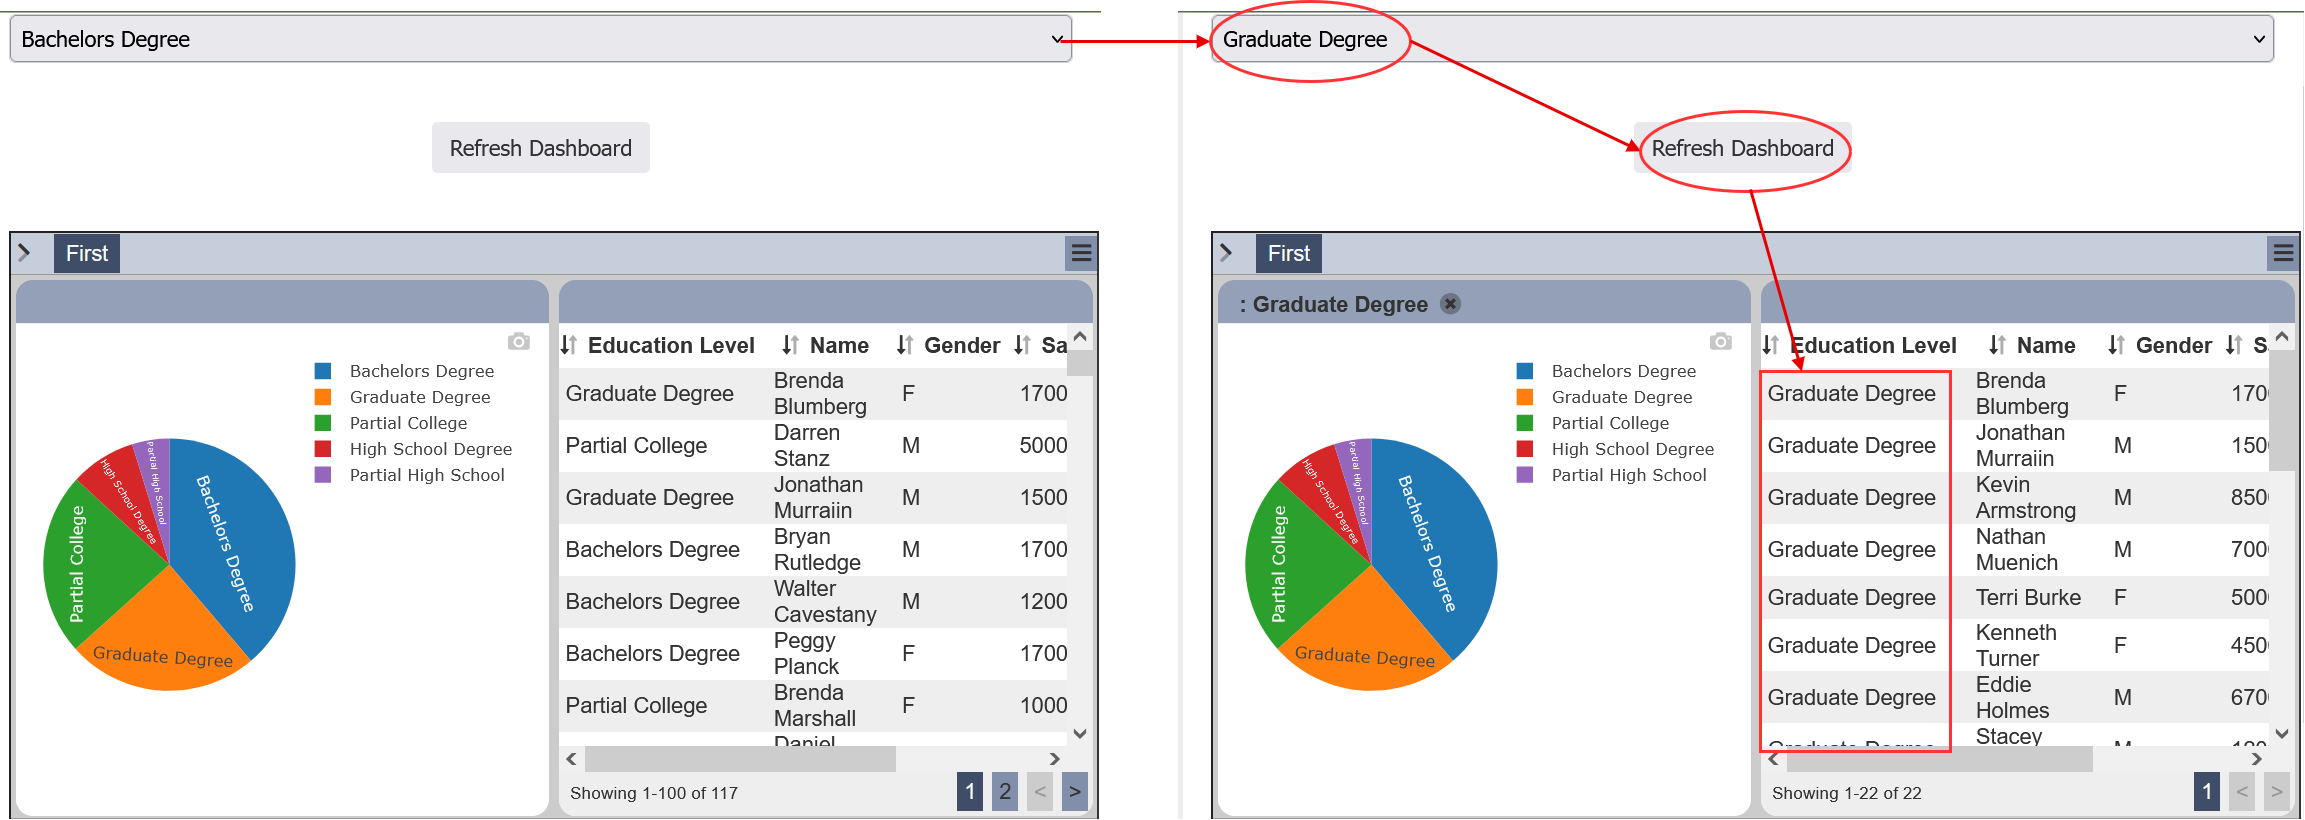
Run Form
Run the form without workflow. Select the desired option from the drop-down list and click the “Refresh Dashboard” button. The dashboard views in the iFrame component changes according to the selection.