
Results Panel
The Results Panel is rightmost panel is the ETL Designer page and it displays the results of the selected execution record in the Output panel. The results are rendered in a table format.
Below are the different components of the panel:
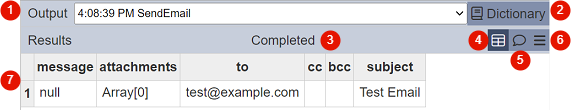
| No. | Description |
|---|---|
| 1 | Allows you to select the output from current and previous runs. |
| 2 | Shows the dictionary for the ETL steps. See Dictionary for details. |
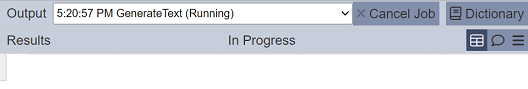
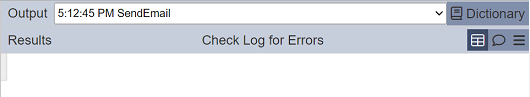
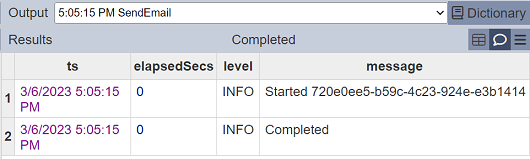
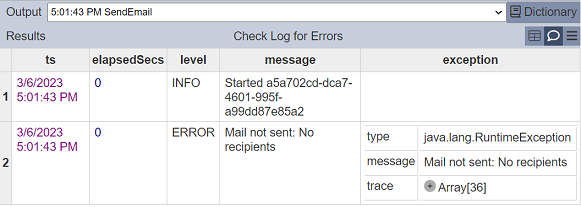
| 3 | Execution status of the chain or chain subset. Completed is labeled for successfully completed runs. If the last step results in a handled error, the error message is displayed as well. When the execution is still ongoing, the label will show Progressing. |
| 4 | Navigates to the grid view, displaying the results. |
| 5 | Shows the event logs related to the execution. |
| 6 | Provides more actions, such as downloading the results in JSON format. |
| 7 | Field names and values of the results (either data or log). Results could have multiple rows. |
On this panel, the following features are available:
- view results
- view logs
- open results in a separate browser tab
- download results
Select Output
Each ETL run generates a result. The result is displayed in the Results panel and is added into the list on the “Output” field. The list is according to the time when the ETL is run, that is, the most current one at the top of the list. The name of the result in the “Output” field can be divided into three parts:
- Prefix timestamp
- Name of ETL chain
- Suffix ETL step
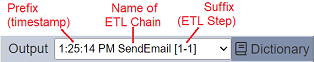
The timestamp allows user to know when the ETL chain/step is run. The name of the ETL chain allows user to know which ETL chain generates the result. The suffix shows which ETL step(s) is run. For example, if the ETL chain consist of two ETL steps and the first ETL step is run, the suffix will show [1-1]. If the second ETL step is run (which will include the first ETL step) the suffix will show [1-2]. This suffix will not appear if the “Run Steps” icon is used.
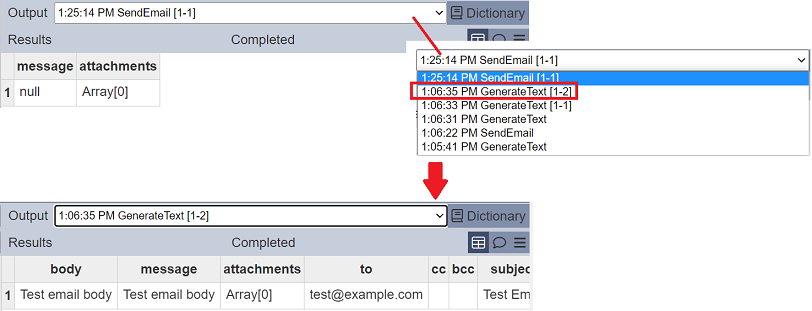
To view the previous ETL run result, click on the drop-down list from the “Output” field and select the desired ETL result. The result will be displayed in the Results panel.
Show Data
The data grid shows the results of the record selected in the Output field. The Results panel has this view loaded by default. Results appear if the execution has already completed successfully.
No data appears if the execution is still ongoing.
Likewise, no data is also displayed if the last step results in an error.
Pagination is applied on the results in the view. 50 rows are displayed per page. Page navigation buttons are available on the footer.

Show Log
To view the event logs created by each step that was executed for the selected record in the Output field. Similar to the view in Show Data, the logs are also displayed in a grid. Field names are displayed on the header. Logs are also displayed in 50 records per page. A log record is also created when skipping a disabled step.
This is useful when troubleshooting steps that have resulted in errors. Most error messages could be nested. Clicking on the arrow button expands the document, displaying its nested contents.
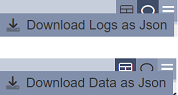
Download Results
Downloading the currently loaded rows, either the data or logs, is available. Click on the 
More Actions button.
If the results of the chain or chain subset are displayed, the download option would export the displayed results into JSON format. Likewise, if the logs are displayed, the download option would export the logs. What data be downloaded is also indicated in the option labels.
The file name of the downloaded file will be <ETLchain><timestamp>.json for data and <ETLchain><timestamp><-logs>.json for logs.