
GIS Explorer
Description
The GIS Explorer allows you to view and edit the map and its metadata. You can also set properties and filter controls for the map.

Do note that the GIS Explorer may be shared and can be used and accessed by GIS View in the dashboard. Also, do note that only users with mod-explorer privilege can access the GIS Explorer page and users with mod-explorer-edit privilege can edit the explorer. These users must be one of the roles selected in properties of the GIS Explorer.
Basic Functions
THe following are the basic functions of the GIS Explorer:
- Zoom in and out
- Turn on/off different layers
- View information of the markers
- Filter control selection
Zoom In/Out
You can zoom in and out of the map by clicking on the “+” and “-” icons on the upper left corner of the map.

Turn On/Off Layers
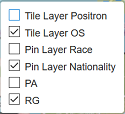
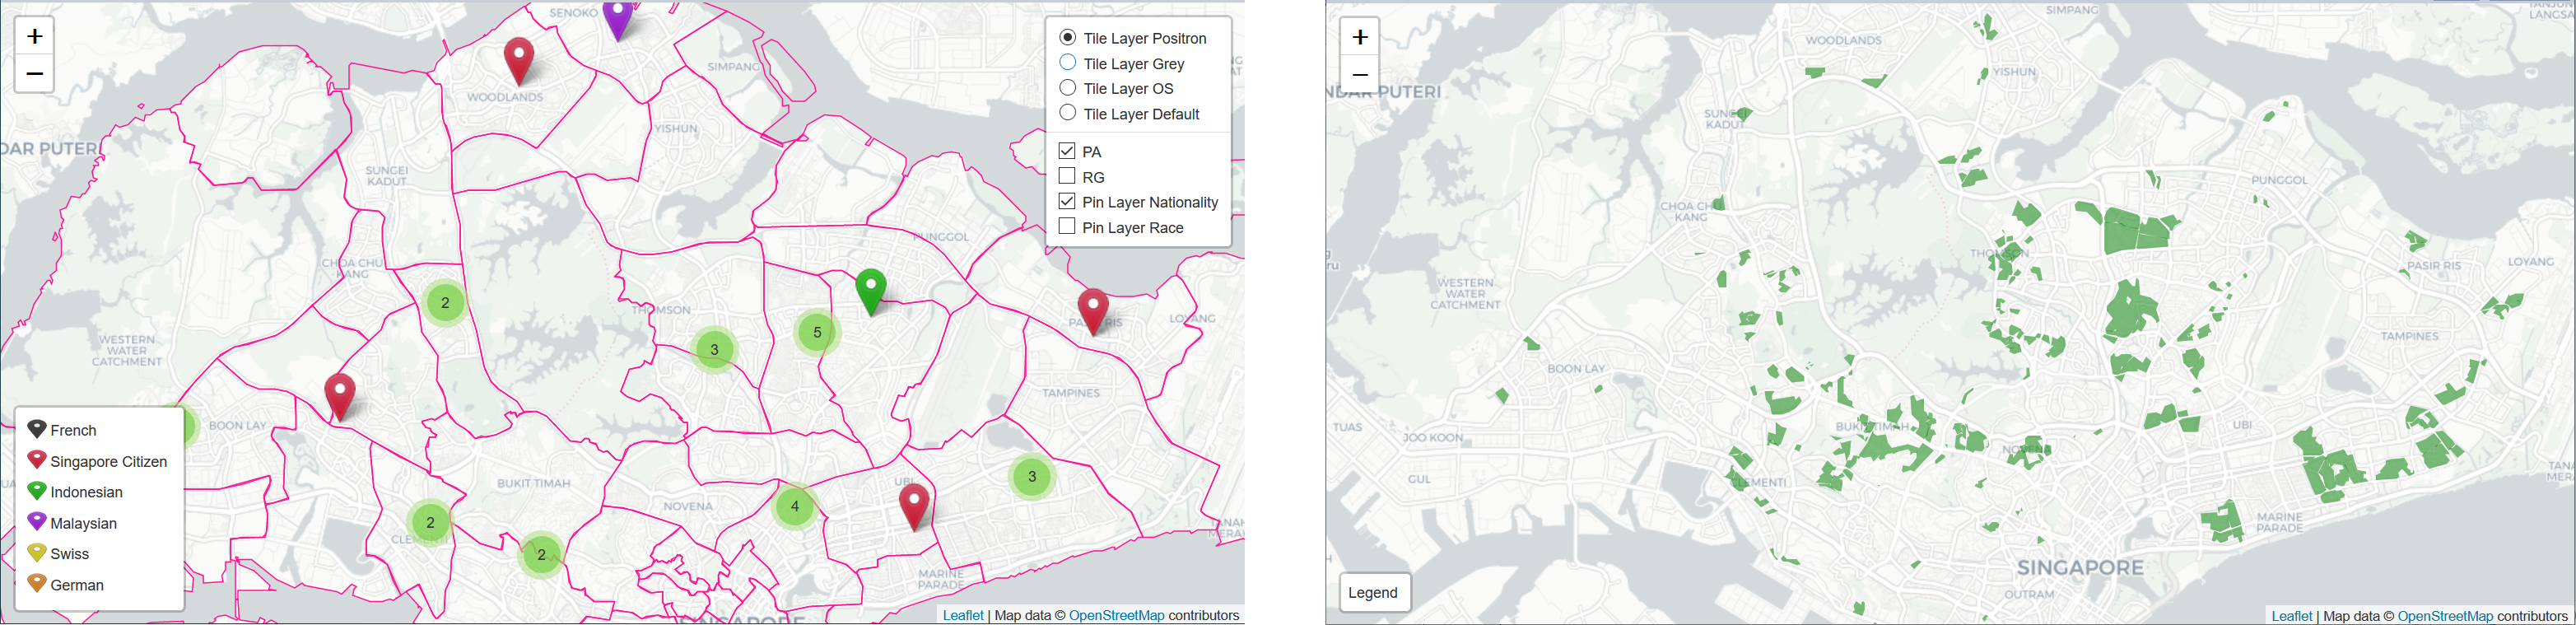
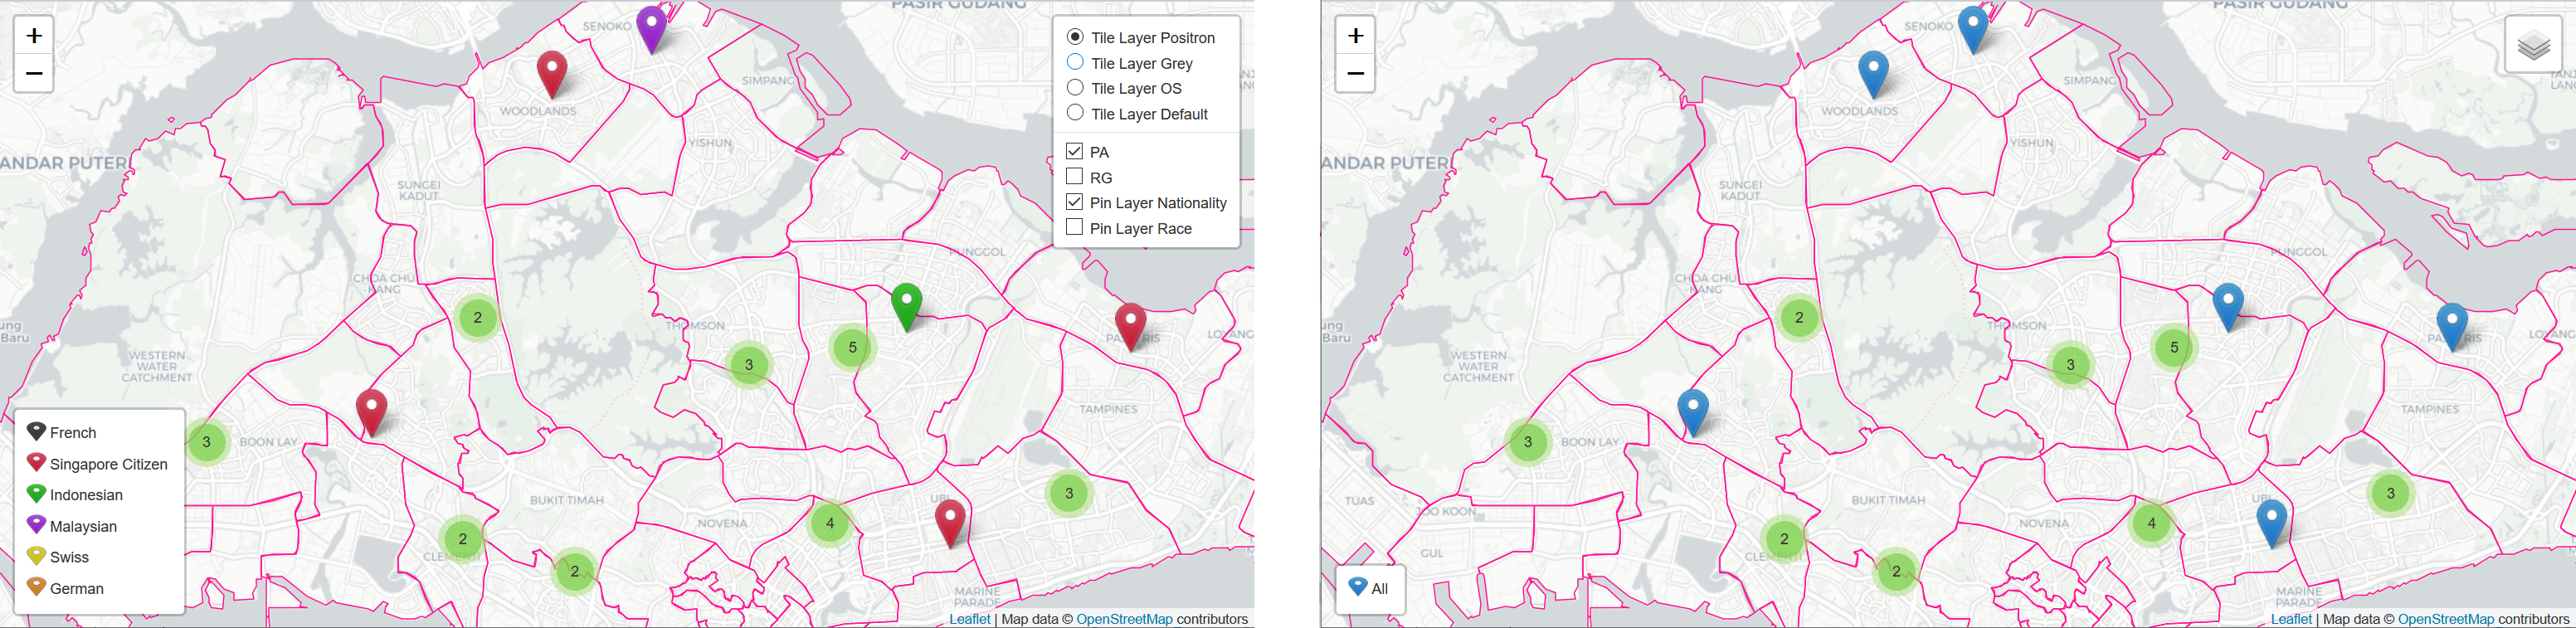
There are different types of layers, such as tile, geo and pin layers. For each type, more than one layer may be created. You can choose to select or turn these layers on or off. Depending on the setting, you may see the different layers or the “Layers” icon at the upper right corner of the map.
If the “Layers” icon is displayed on the map, hover over the “Layers” icon to display the different layers available for selection. Choose a different tile layer by selecting one of the radio buttons of the tile layers. Select the checkbox to turn on or unselect to turn off the desired layer.

If the different layers are displayed on the map, simply select or unselect as desired.
The tile layers can be presented as tiles layers or purely as layers, while the geo, pin and density heatmap layers are presented as layers. When presented as tiles, only one tile can be chosen at any one time. When presented as layers (see below), multiple layers can be selected. In this case, ensure one of the tile layers are selected at any one time, or else an empty map will be displayed.
If the geo, pin or density heatmap layers are not selected, a bare map will appear.

Do note that if the layer selection is not enabled, the “Layers” icon or the layers will not appear on the map.
View Information
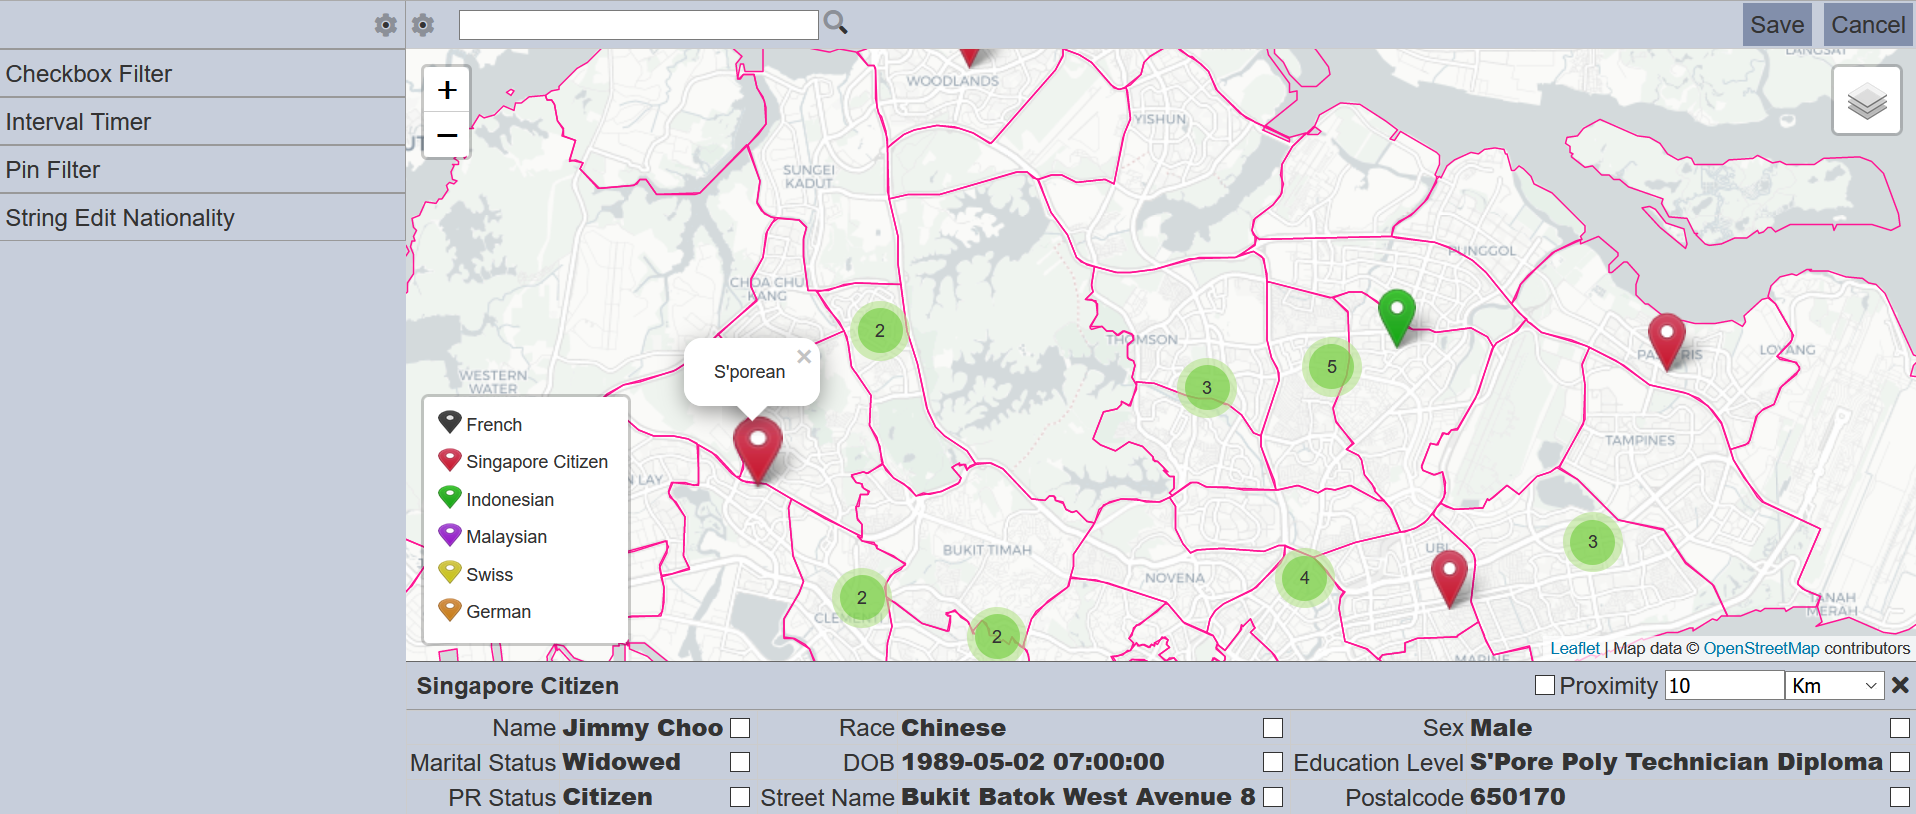
Click on any marker on the map, the Information Panel will appear at the bottom of the page.
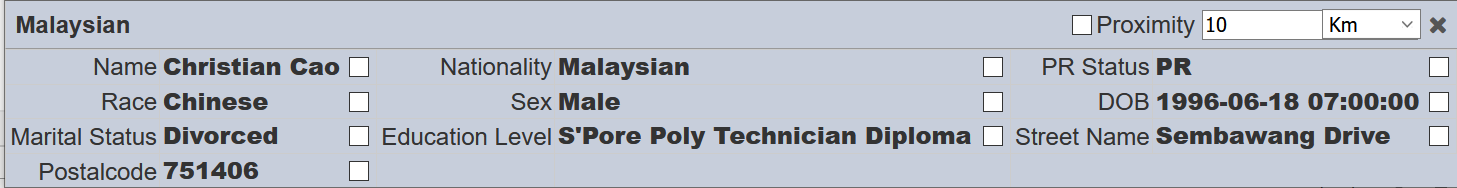
The actual information that appears will depend on the datasource chosen and how the “Info Filter” control is being set up for the selected marker. The sample shown here is mock up data and while it is intended to be realistic, does not represent any real people or situations.
The panel displays information of the selected marker. You can select one or more checkboxes to filter the markers on the map. For example, in this mock dataset, you can select “Nationality Malaysian” checkbox and the map will display all markers with Nationality that are Malaysian.
You can also use the “Proximity” field to filter the markers that are at a predefined distance from the currently selected marker. To do so, key in the desired distance and select the checkbox on the left of the “Proximity” field. The map will display the markers that are within the defined distance.
To close the panel, click on the “X” icon on the upper right corner of the panel or click on the selected marker.
Filter Control Selection
The filter control allows you to control the data to be displayed in the map. When the page is in edit mode, you can add, edit and delete the filter controls.
To access the filter control panel, click on the “>” icon on the upper left corner of the page, next to the search function to display the Filter Control Panel. Any filter control that are set as always visible will be displayed in the panel. Filter controls that are not set as visible works in the background.
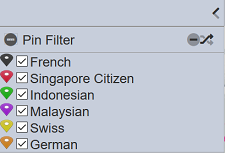
Click on the  icon on the left of the corresponding filter control to display the list of available options. Click on the checkboxes to select or unselect the options. The markers on the map will change according to your selection.
Depends on the type of filter control, there may be 2 buttons  on the right of the filter control. The left button deselects all options. The right button inverts the selected options. This means that all options that are selected become deselected. Likewise, all options that are deselected become selected.
To close the filter control, click on the  icon on the left of the corresponding filter control. Do note that the selection on the filter control will be reset once the filter control is closed.
Edit Mode
To edit the GIS Explorer, click on the “Edit” button at the upper right corner of the page.

In edit mode, the GIS Explorer page will display and allow edit on the following via their respective  icons:
- Filter Controls (left panel)
- Map Properties (right panel)
Filter Controls
The Filter Control Panel is located on the left of the page. To access the filter controls, click on the icon in the upper right corner of the Filter Control Panel. The “Control Properties” dialog box will appear, listing all existing filter controls for the explorer. In the “Control Properties” dialog box, you can add, edit, delete and re-arrange the filter controls.

Add
To add a filter control, click on the “+” icon and a new filter control (new row) will be added.
Edit
To edit a filter control, click on the “…” icon next to the corresponding filter to display the “Control” dialog box.
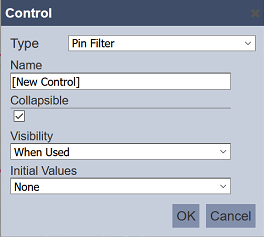
There are several types of filter controls for GIS Explorer. The fields for each type of filter control differs. Refer to Controls for more details.
Delete
To delete the filter control, click on the  icon.
icon.
Re-arrange
You can re-arrange/sort the filter controls by clicking on the  and/or
  icons next to the corresponding filter controls. That will determine the order of the filter controls that will appear in the Filter Control Panel in view mode.
Map Properties
The Map Properties on the right of the page allows you to edit or set up the map and markers in the GIS Explorer, as well as the information of the markers.
To access to the Map Properties, click on the icon on the upper left corner of the map (next to the Filter Control Panel). The “Map Properties” dialog box that appears consists of five sections.
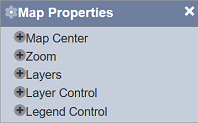
| Section | Description |
|---|---|
| Map Center | Defines the initial center of the map. |
| Zoom | Defines the initial, minimum and maximum zoom factors. |
| Layers | Defines the different layers. |
| Layer Control | Defines which layers are to be displayed on the map and the initial layers to be used. |
| Legend Control | Defines the legend properties. |
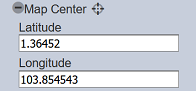
The “Map Center” section allows you to set the initial center of the map.
| Field | Description | Mandatory | Input Type | Constraints | Default Value |
|---|---|---|---|---|---|
 Use Current Center Icon |
When clicked, uses the current location on map as map center. | N | Icon | None | None |
| Latitude | Defines the latitude coordinate of the map center. | Y | Text field | -90 to 90 | Dependent on map |
| Longitude | Defines the longitude coordinate of the map center. | Y | Text field | -180 to 180 | Dependent on map |
Do note that for numeric fields, when the number is entered, you have to hit the “Enter” key for the change to be effective.
The “Zoom” section allows you to set the zoom factors.

| Field | Description | Mandatory | Input Type | Constraints | Default Value |
|---|---|---|---|---|---|
| Initial | Defines the initial zoom value. The  icon next to the text field can be used to set the initial zoom value using the current zoom value on the map. icon next to the text field can be used to set the initial zoom value using the current zoom value on the map. |
Y | Text field | Integer greater than or equals to 1 | “12” |
| Min | Defines the minimum zoom value. | Y | Text field | Integer from 0 to 25 | “0” |
| Max | Defines the maximum zoom value. | Y | Text field | Integer from 0 to 25 | “18” |
Do note that for numeric fields, when the number is entered, you have to hit the “Enter” key for the change to be effective.
The “Layers” section allows you to set up and edit the different layers for the explorer. It is divided into several sub-sections. These layers can be then be selected to be displayed on the map, as well as made selectable for users.
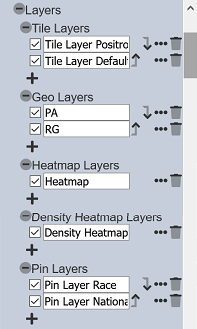
Each sub-section allows you to perform the following:
- Enable/disable a layer
- Delete a layer
- Add a layer
- Edit a layer
- Arrange the layers
When a layer is initially added, it is enabled by default. To disable a layer, unselect the checkbox on the right of the layer.
To delete a layer, click on the icon next to the desired layer.
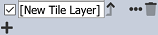
To add a layer, click on the “+” icon. A new layer (new row) will be added. Below is an example of a newly added tile layer.
To edit the properties of a layer, click on the “…” icon next to the desired layer to display the layer’s dialog box.
You can re-order a particular group of layers (e.g., geo layers) by clicking on the and next to the layers.
Tile Layers
The Tile Layers sub-section allows you to set up one or more tile layers for the map.

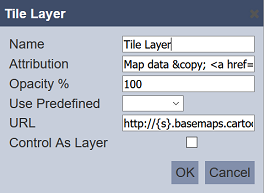
To edit the properties of a tile layer, click on the “…” icon next to the desired layer to display the “Tile Layer” dialog box.
| Field | Description | Mandatory | Input Type | Constraints | Default Value |
|---|---|---|---|---|---|
| Name | Unique name of the tile layer. | Y | Text field | Any text | “[New Tile Layer]” |
| Attribution | Defines the attribution text to be displayed at the bottom of the map. | N | Text field | Any text | Empty |
| Opacity % | Defines how opaque the tile layer outline are in percentage. | Y | Text field | Integer from 0 to 100 | “100” |
| Use Predefined | Selects the predefined tile layer. Options are: - Not Selected (blank) - Default - Grey - OS - Positron |
Y | Drop-down list | Select from drop-down list | Not selected (blank) |
| URL | Defines the location of the map. | Y | Text field | Any text | Empty |
| Control As Layer | If selected, allows the tile layer to be controlled as a layer. | Y | Checkbox | Selected or not selected | Not selected |
Do note that when “Use Predefined” field is selected (that is, not blank), the selection will override any previous settings made.
When the “Control As Layer” field is not selected, the tile layer is presented as a tile on the map with single selection mode. When the “Control As Layer” field is selected, the tile layer is presented as a layer on the map with multiple selection mode. In this mode, it is advisable to reduce the opacity to enable the layers to see through each other.
Geo Layers
The Geo Layers sub-section allows you to set up one or more the geo layers for the map.
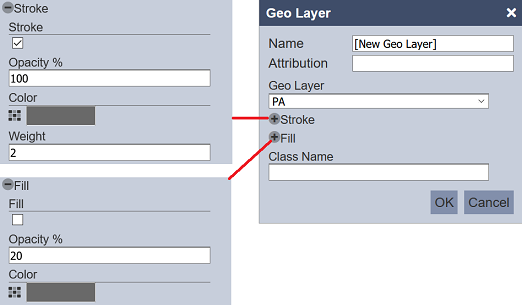
To edit the properties of a geo layer, click on the “…” icon next to the desired layer to display the “Geo Layer” dialog box.
| Field | Description | Mandatory | Input Type | Constraints | Default Value |
|---|---|---|---|---|---|
| Name | Defines the name of the geo layer. | Y | Text field | Any text | “[New Geo Layer]” |
| Attribution | Defines the attribution text to be displayed at the bottom of the map (optional). | N | Text field | Any text | Empty |
| Geo Layer | Selects the geo layer. | Y | Drop-down list | Select from drop-down list | Not selected |
| Stroke | |||||
| Stroke | If selected, adds a geo layer outline onto the map with the defined properties. | N | Checkbox | Enable or disable | Selected |
| Opacity % | Defines how opaque the geo layer outline are in percentage. | Y | Text field | Integer from 0 to 100 | “100” |
| Color | Selects the colour of the geo layer outline. | Y | Colour map | Select from map | “Dim grey” |
| Weight | Defines the weight of the outline of geo layer. | Y | Text field | Integer from 1 to 50 | “2” |
| Fill | |||||
| Fill | If selected, fills the geo layer with the colour selected in colour palette. | N | Checkbox | Enable or disable | Not selected |
| Opacity % | Defines how opaque the geo layer outline are in percentage. | Y | Text field | Integer from 0 to 100 | “100” |
| Color | Selects the colour of the geo layer. | Y | Colour map | Select from map | “Dim grey” |
| Class Name | Defines the CSS class. | N | Text box | CSS class name | None |
The options available for “Geo Layer” field depends on the GeoJson file loaded into Ambience.
The Heatmap Layers sub-section allows you to set up one or more heatmap layers for the map.
To edit the heatmap, click on the “…” icon next to the desired heatmap layer to display the “Heatmap Layer” dialog box.
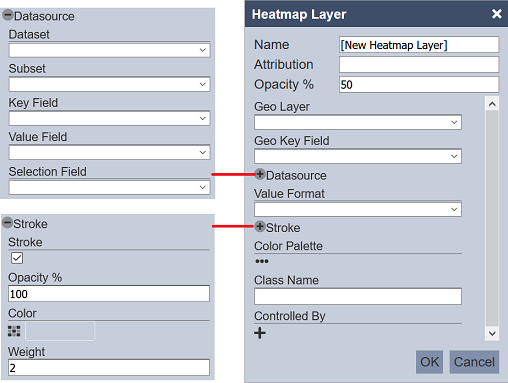
| Field | Description | Mandatory | Input Type | Constraints | Default Value |
|---|---|---|---|---|---|
| Name | Defines the name of the heatmap layer. | Y | Text field | Any text | [New Pin Layer] |
| Attribution | Defines the attribution text to be displayed at the bottom of the map. | N | Text field | Any text | Empty |
| Opacity % | Defines how opaque the pin layer outline are in percentage. | Y | Text field | Integer from 0 to 100 | “50” |
| Datasource | |||||
| Dataset | Selects the heatmap dataset. | Y | Drop-down list | Select from drop-down list | Not selected |
| Subset | Selects the heatmap subset. | N | Drop-down list | Select from drop-down list | Not selected |
| Key Field | Selects the key field. | Y | Drop-down list | Select from drop-down list | Not selected |
| Value Field | Selects the value field. | Y | Drop-down list | Select from drop-down list | Not selected |
| Selection Field | Defines the field for selection in the GIS View. | N | Drop-down list | Select from drop-down list | Not selected |
| Stroke | |||||
| Stroke | If selected, adds a geo layer outline onto the map with the defined properties. | Y | Checkbox | Enable or disable | Selected |
| Opacity % | Defines how opaque the geo layer outline are in percentage. | Y | Text field | Integer from 0 to 100 | “100” |
| Color | Selects the colour of the geo layer outline. | Y | Colour map | Select from map | “Transparent” |
| Weight | Defines the weight of the outline of geo layer. | Y | Text field | Integer from 1 to 50 | “2” |
| Value Format | Defines the format of the value field. | N | Drop-down list | Selection | “None” |
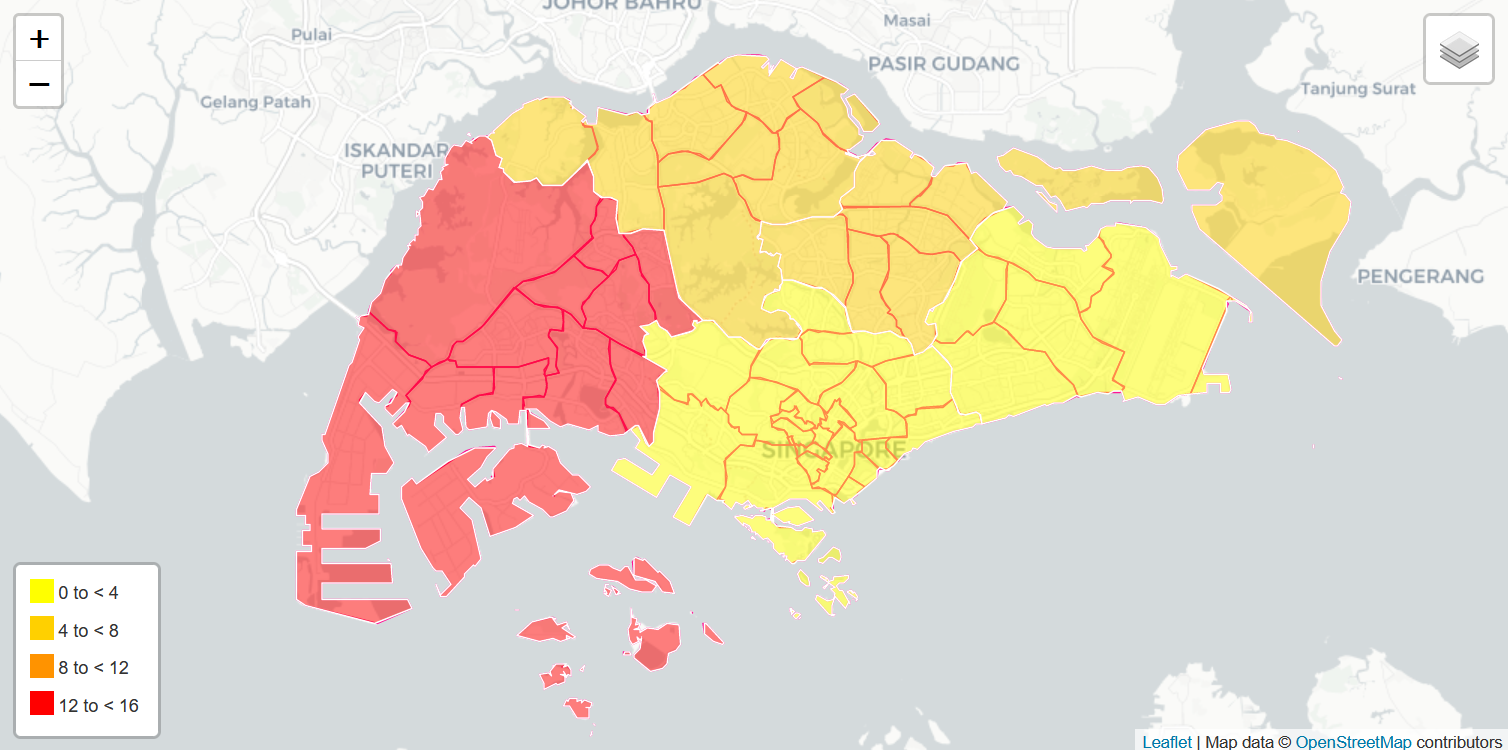
| Colour Palette | Defines the colours to be displayed as heatmap in the map. | N | Colour Palette | Selection | Empty |
| Controlled By | Add or remove filter controls for the explorer. if there are no controls available for the explorer, the drop-down list will not appear. |
N | Drop-down list | Select from drop-down list | Not selected |
The Colour Palette allows you to choose the colours to be displayed in the heatmap, as well as the gradient of the heatmap.
The “Color Inputs” field allows you to choose the colour either from:
- “Color Picker”
- “Color Finder” search function
- “Color List Input” by keying in the desired colours
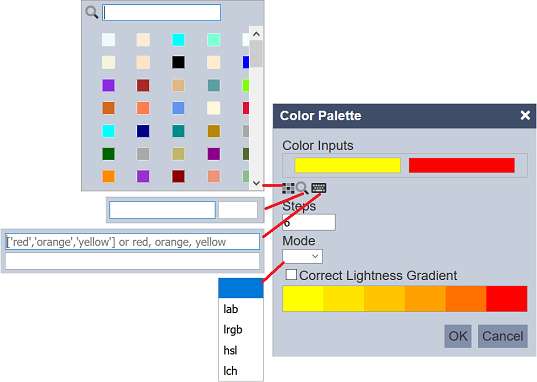
The latest selected colour will be placed at the end of the “Color Inputs” field. The colour bar at the bottom of the dialog box will change according to the colour selected. To remove a colour, hover over the colour and click on the icon that appear at the right of the colour.
The “Step” and “Mode” fields allows you to select the gradient of colour and the various modes available respectively.
The Density Heatmap Layers sub-section allows you to set up one or more density heatmap layers for the map.
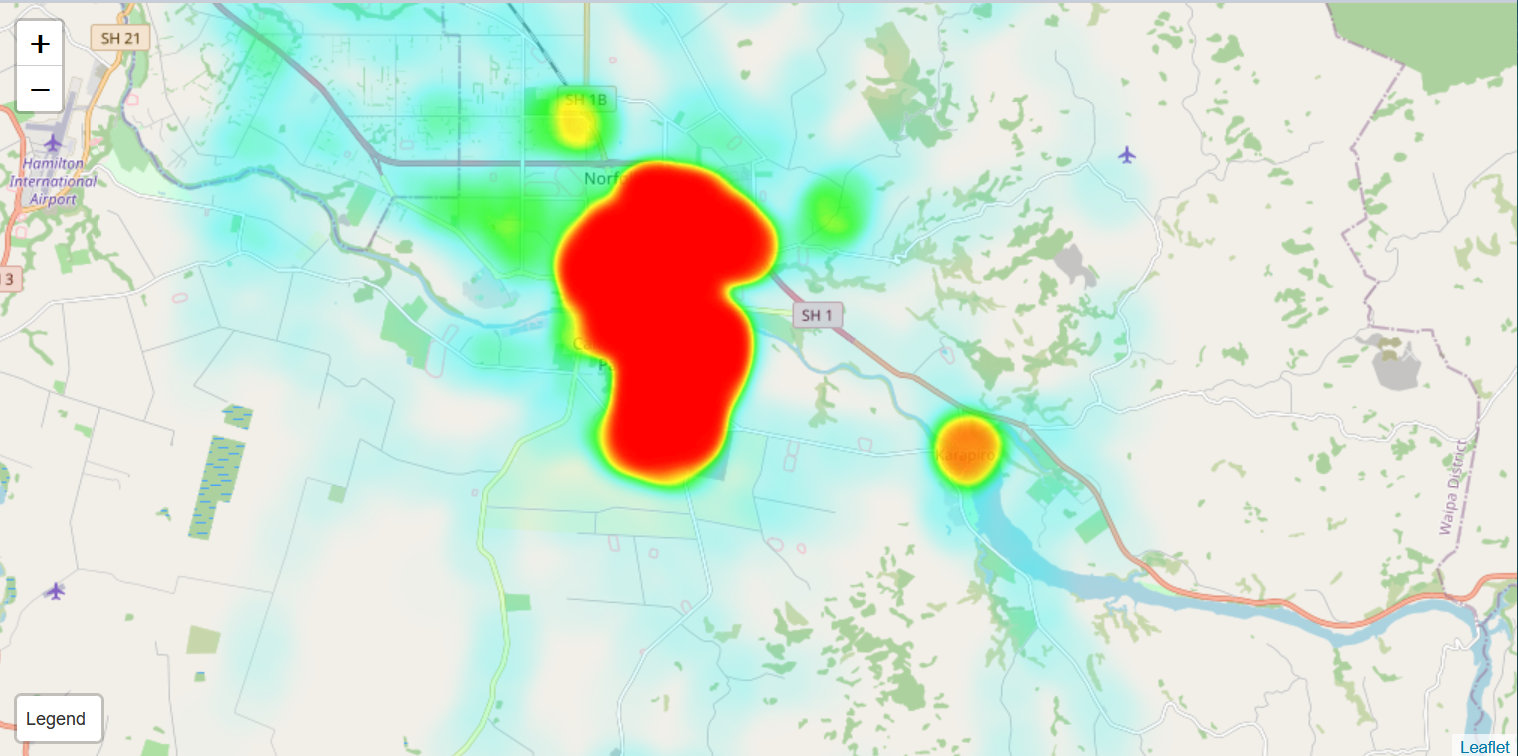
To edit the pins, click on the “…” icon next to the desired density heatmap layer to display the “Density Heatmap Layer” dialog box.
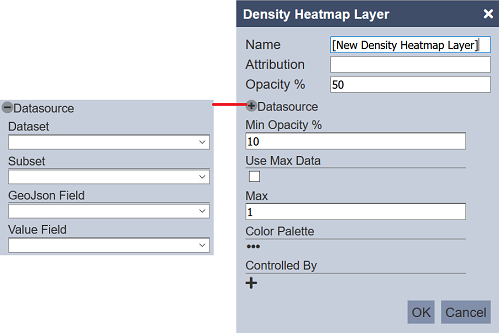
| Field | Description | Mandatory | Input Type | Constraints | Default Value |
|---|---|---|---|---|---|
| Name | Defines the name of the density heatmap layer. | Y | Text field | Any text | [New Pin Layer] |
| Attribution | Defines the attribution text to be displayed at the bottom of the map. | N | Text field | Any text | Empty |
| Opacity % | Defines how opaque the pin layer outline are in percentage. | Y | Text field | Integer from 0 to 100 | “50” |
| Datasource | |||||
| Dataset | Selects the geo dataset. | Y | Drop-down list | Select from drop-down list | Not Selected |
| Subset | Selects the geo subset. | N | Drop-down list | Select from drop-down list | Not Selected |
| GeoJson Field | Selects the geo JSON field. | Y | Drop-down list | Select from drop-down list | Not Selected |
| Value Field | Selects the value field. | Y | Drop-down list | Select from drop-down list | Not Selected |
| Min Opacity % | Defines the minimum opacity in percentage to allow colour to see through for a better view. | Y | Textbox | Numeric | “10” |
| Use Max Data | If selected, uses the maximum value from the “Value” field. | Y | Checkbox | Enable or disable | Not selected |
| Max | Defines the maximum value to be used. If “Use Max Data” field is selected, this field is ignored. |
Y | Textbox | Numeric | “1” |
| Colour Palette | Defines the colours to be displayed as density heatmap in the map. | N | Colour Palette | Selection | Empty |
| Controlled By | Add or remove filter controls for the explorer. | N | Drop-down list | Select from drop-down list | Not Selected |
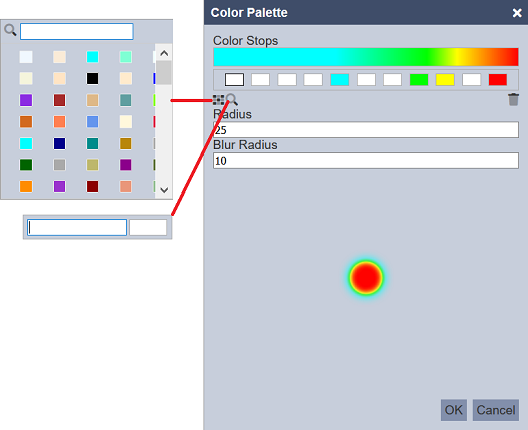
The Colour Palette allows you to choose the colours to be displayed in the density heatmap, as well as the size and density gradient.
The “Color Stops” field allows you to choose the colours, either using the “Colour Picker” or “Color Finder” (search function) located below the field. To define a colour, select the desired box and select the desired colour. The location of box determines where the colour will stop. In the example below, the colour green is located at the eighth box, which means the colour green will start from the sixth box and ends at the eighth box. You can remove a colour from the “Color Stops” field by selecting the desired box and clicking on the icon.
The “Radius” and “Blue Radius” fields allows you to define the size and gradient of the colour respectively.
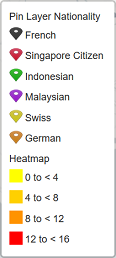
The Pin Layers sub-section allows you to define the properties of the markers or pins to be displayed on the map. More than one layer can be defined. It also allows you to include filter controls on the markers to define the colour of the markers, information to be displayed for the selected marker, etc. Without the pin layer, no markers or pins will appear on the map.
To edit the pins, click on the “…” icon next to the desired pin layer to display the “Pin Layer” dialog box.
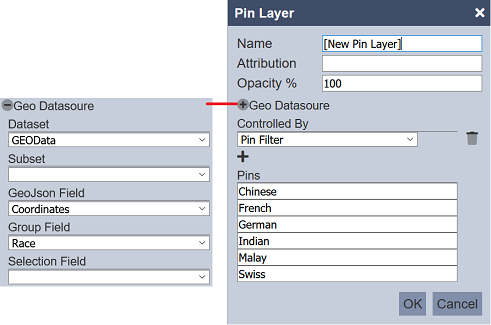
| Field | Description | Mandatory | Input Type | Constraints | Default Value |
|---|---|---|---|---|---|
| Name | Defines the name of the pin layer. | Y | Text field | Any text | [New Pin Layer] |
| Attribution | Defines the attribution text to be displayed at the bottom of the map. | N | Text field | Any text | Empty |
| Opacity % | Defines how opaque the pin layer outline are in percentage. | Y | Text field | Integer from 0 to 100 | “100” |
| Geo Datasource | |||||
| Dataset | Selects the geo dataset. | Y | Drop-down list | Select from drop-down list | Not selected |
| Subset | Selects the geo subset. | N | Drop-down list | Select from drop-down list | Not selected |
| GeoJson Field | Selects the geo JSON field. | Y | Drop-down list | Select from drop-down list | Not selected |
| Group Field | Places the output of the dataset./subset into separate groups or data traces based on field selected. | Y | Drop-down list | Select from drop-down list | Not selected |
| Selection Field | Defines the field for selection in the GIS View. | N | Drop-down list | Select from drop-down list | Not selected |
| Controlled By | Add or remove filter controls for the explorer. | N | Drop-down list | Select from drop-down list | Not selected |
| Pins | Displays the pins according to the value selected in Group Field. | N | Text field | Not editable | Empty |
When used in GIS View in the dashboard, the “Selection Field” field set above provides a field to control other views in the dashboard. The “Group Field” field can be used in the same manner.
The Layer Control section allows you to select the different layers to be displayed on the map and the layers to be made selectable for the users.
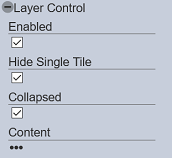
| Field | Description | Mandatory | Input Type | Constraints | Default Value |
|---|---|---|---|---|---|
| Enabled | Enables/disables the layer control. | Y | Checkbox | Enable or disable | Enabled |
| Hide Single Tile | If selected, and if one tile layer is selected in the Content field, the explorer will not display the tile layer of the map. | N | Checkbox | Enable or disable | Disabled |
| Collapsed | If selected, allows the layer control to be collapsed when not in use. | N | Checkbox | Enable or disable | Disabled |
| Content | Defines which layer(s) to be displayed on the map. | N | Dialog box | Selection | Not selected |
To set up the “Content” field, click on the “…” icon below the field. The “Layer Control Content” dialog box will appear.

| Field | Description | Mandatory | Input Type | Constraints | Default Value |
|---|---|---|---|---|---|
| Tiles | Selects the tile layers to be displayed on the map. If more than one tile later is selected, the first tile layer at the top will be set as initial value. |
N | Checkbox | Tile Layer sub-section must be set up and enabled | Not selected |
| Layers | Selects the other layers (except tile layers) to be displayed on the map and set the initial options. | N | Checkbox | The respective layers sub-section must be set up and enabled | Not selected |
There are two sections in the “Layer Control Content” dialog box. The “Tiles” section selects the tile layers, while the “Layers” section selects the other layers. These layers must be set up in the Layers sub-section prior setting the layer control content.
In the “Tile” section, select the outer checkboxes next to the desired tile layers to enable them. If more than one tile layers are selected, the topmost tile layer will be set as the initial option. You can change this initial option by clicking on the radio button of the desired tile layer.
For the “Layers” section, enable the desired layers by selecting the outer checkboxes. This action will enable the inner checkboxes of the selected layers, as well as enabling the users to see the layers on the map. Set the initial option by selecting the inner checkboxes of the desired layers. This will enable the selected layers on the map.
The order of the layers can be re-arranged by clicking on the and icons. This change will be reflected on the map as well.
The Legend Control section allows you to define how the legend of the pins and/or heatmap are to be displayed in the GIS Explorer.
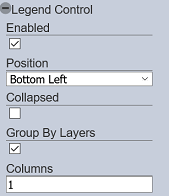
| Field | Description | Mandatory | Input Type | Constraints | Default Value |
|---|---|---|---|---|---|
| Enabled | Enables/disables the legend control. | Y | Checkbox | Enable or disable | Enabled |
| Position | Defines the location of the legend in the map. Available options: - Top Left - Top Right - Bottom Right - Bottom Left |
Y | Drop-down list | Selection | “Bottom Left” |
| Collapsed | If selected, allows the legend control to be collapsed when not in use. | N | Checkbox | Enable or disable | Disabled |
| Group By Layers | If selected, groups the legend by layers. | Y | Checkbox | Enable or disable | Enabled |
| Columns | Displays the legend in the number of columns defined. | N | Textbox | Numeric | “1” |
Refresh
The manual “Refresh” button is available and is particularly useful if there are other users currently editing on the same page.
The “Refresh” button is found on the upper right corner of the page. Clicking on it reloads the map.