
Data Field
The  Data Field is used for dynamic binding of data into a report at runtime.
Add Data Field
To add a data field onto the report, select the “Data Field” button and click onto the location in the report where the data field is to be placed. A “Field Wizard” will appear.
This wizard has four tabs, namely “Field”, “Font”, “Format” and “Scripts”.
Field Tab
In the “Field” tab, there are five options for the “Field Type”:
Select the desired field type in the “Field Type” field (except “Literal”). Selecting “Literal” will change the element into a Label element.
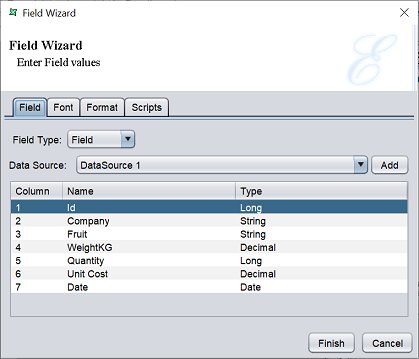
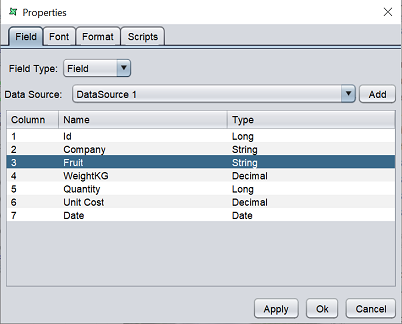
If the “Field” option is selected in the “Field Type” field, the following screen will appear.
If the “Data Source” field is empty, it means no datasource is selected for the report. Add a datasource to the report by clicking on the “Add” button to display the “Configure DataSoruce” dialog box. Select a desired datasource from the repository and configure the datasource as required. Click in the “Finish” button to add the datasource.
Select the desired field from the table.
In the “Font” tab, change the font and style as desired.
Select the format type for the data field in the “Format” tab.
Once added into the report, the datasource along with the field selected will appear as DataSource 1:FieldSelected in the location selected.
If the “Operation” option is selected in the “Field Type” field, the following screen will appear.
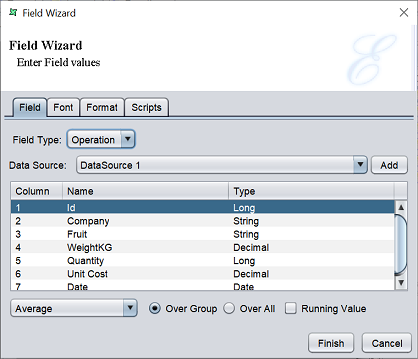
If the “Data Source” field is empty, it means no datasource is selected for the report. Add a datasource to the report by clicking on the “Add” button to display the “Configure DataSoruce” dialog box. Select a desired datasource from the repository and configure the datasource as required. Click in the “Finish” button to add the datasource.
Select the desired field from the table.
Select the desired operation from the drop-down list below the table. By default “Average” is selected. To perform the function calculation over a particular group, select the “Over Group” radio button (default). To perform the function calculation over the whole set of data, select the “Over All” radio button.
Combining the “Over Group” or “Over All” with the “Running Value” field, allows you to determine the range of records that the operation will apply to.
The start of the range is controlled by “Over Group” or “Over All” field. With “Over All” chosen, the range begins with the first record of the datasource. With “Over Group” chosen, the range begins with the first record of the current group.
If “Running Value” field is not selected, the end of the range is based on “Over Group” or “Over All” field. If “Running Value” field is selected, the end of the range is based on the current record.
Once added into the report, the data field will appear in the report layout. For example, Count(DataSource 1:FeldSelected) if “Count” is selected as the operation.
If the “Script” option is selected, the following screen will appear.
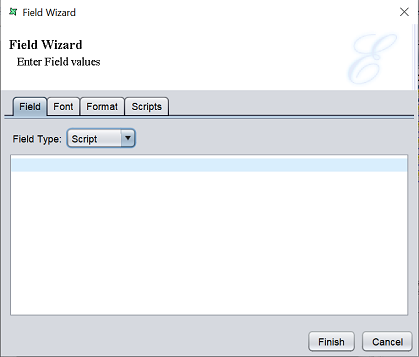
Key in the Java script in the textbox.
If the “URL” option is selected, the following screen will appear.

Key in the URL in the textbox or click on the  button to display the repository dialog box to select the desired file.
Edit the font and style in the “Font” tab and the format type in the “Format” tab.
If the “Literal” option is selected, the following screen will appear.
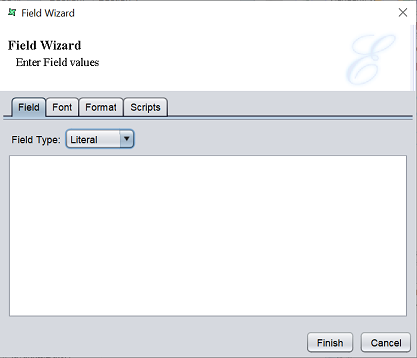
In this mode, the data field will act as a label in the report. Key in the desired text in the textbox and click o the “Finish” button.
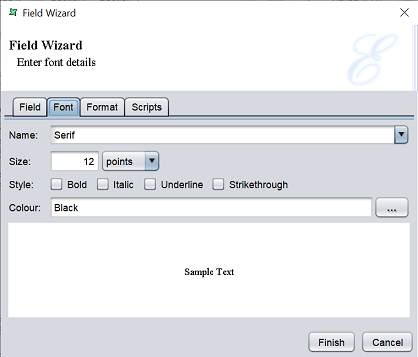
Font Tab
This tab displays the default settings (such as font size, type, etc.) for the data field.
| Field | Description | Type |
|---|---|---|
| Name | Selects the font type. Default value is “Serif”. |
Drop-down list |
| Size | Selects the font size. Default value is 12 points. |
Textbox |
| Style | Selects the font style. Available options: - Bold - Italic - Underline - Strikethrough |
Checkbox |
| Colour | Selects the font colour. Default value “Black”. |
Textbox / Colour Chooser |
Select the font type, size, style as desired. You can choose the colour of the font by either entering the name of the colour in the textbox, or click on the button to display the “Colour Choose” dialog box.
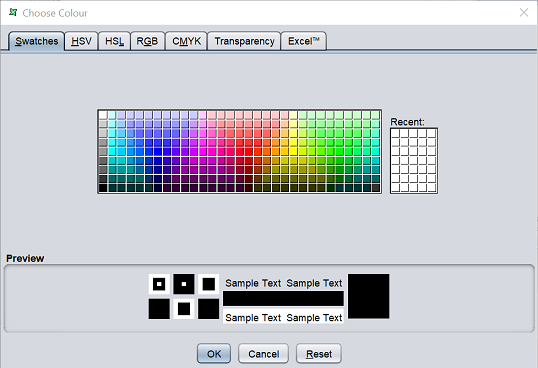
Select the desired colour in the tabs and the transparency in the “Transparency” tab. Click on the “OK” button to save the change and close the dialog box.
Format
This tab allows you to select and setup the format of the data.
For example, if the data is a percentage of some value, you may wish to add “%” at the end of the data. Or if the data is currency, you may wish to add the currency symbol.
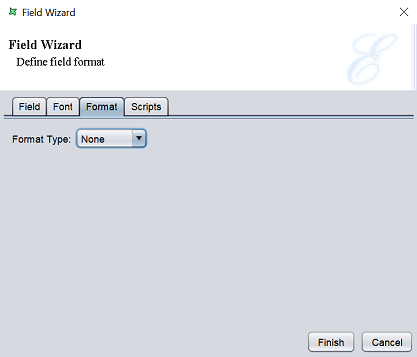
There are five options in the “Format Type” field:
- None (default)
- Currency
- Percent
- Number
- Data/Time
The default option is none, such means no special formatting will be carried out on the data.
The “Currency”, “Percent” and “Number” option has the same set of fields. Below is an example of the fields for the “Currency” option.
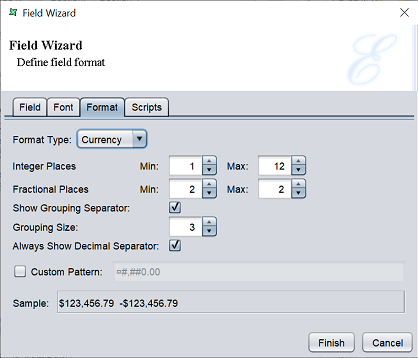
The fields allows you to set up the format of the currency. By default, the “Custom Pattern” is not selected. This allows you to set up the format of the currency value with the fields above it. If selected, all other fields will be disabled, except the textbox next to the field. You can set up the currency format in the textbox.
The “Sample” field at the bottom of the tab shows you the current format.
For the “Date/Time” option, the following screen will appear.
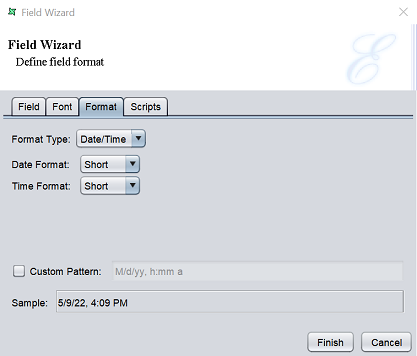
Select the desired date and time format from their respective drop-down list. Alternatively, you can select hte “Custom Pattern” checkbox and key in the custom format in the textbox that is enabled.
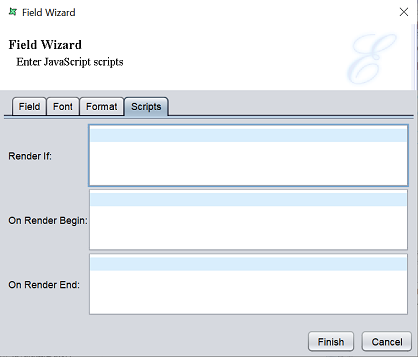
Scripts
This tab has three panels which allows you to add Java scripts:
- Render If
- On Render Begin
- On Render End
The JavaScript functions that are entered in these text boxes are executed when the data field is rendered.
Edit Data Field
To edit the Data Field element in the report template, double-click on the Data Field element to display the “Properties” dialog box.
The tabs are similar to the Field Wizard.