
SVG
The  SVG element allows you to add a scalable vector graphics onto the report.
This is a proposed format by the World Wide Web Consortium (W3C) for web page graphics based on vectors, rather than bitmap formats. It defines graphics in XML format. These files will normally by smaller than bitmap files and will scale to different size screens, without losing any quality if zoomed or resized. Every element and attribute in the SVG file can be animated.
Add SVG
To add a SVG graphic in the report, select the “SVG” button and click on the location where the SVG graphic is to be placed. A “SVG Wizard” will appear.
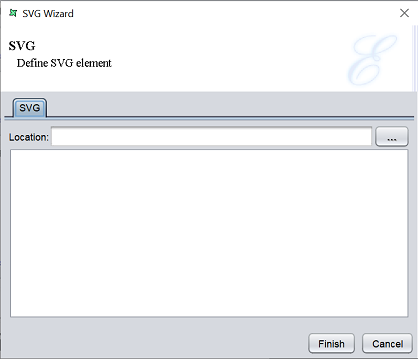
Key in the location of the SVG file in the “Location” field or click on the  button to select the SVG file in the repository.
Edit SVG
To edit the SVG element in the report template, double-click on the SVG element to display the “Properties” dialog box.
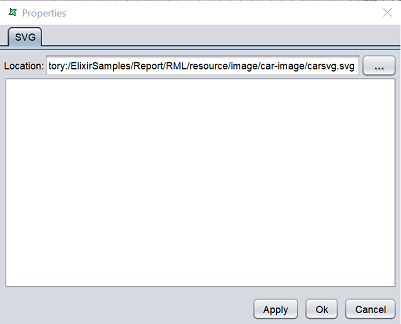
The dialog box is similar to the SVG Wizard.