Sales Report
This example shows how to create a RML report that creates sales report
This involves three steps:
- Create datasource
- Create RML template
- Edit RML Template
Create Datasource
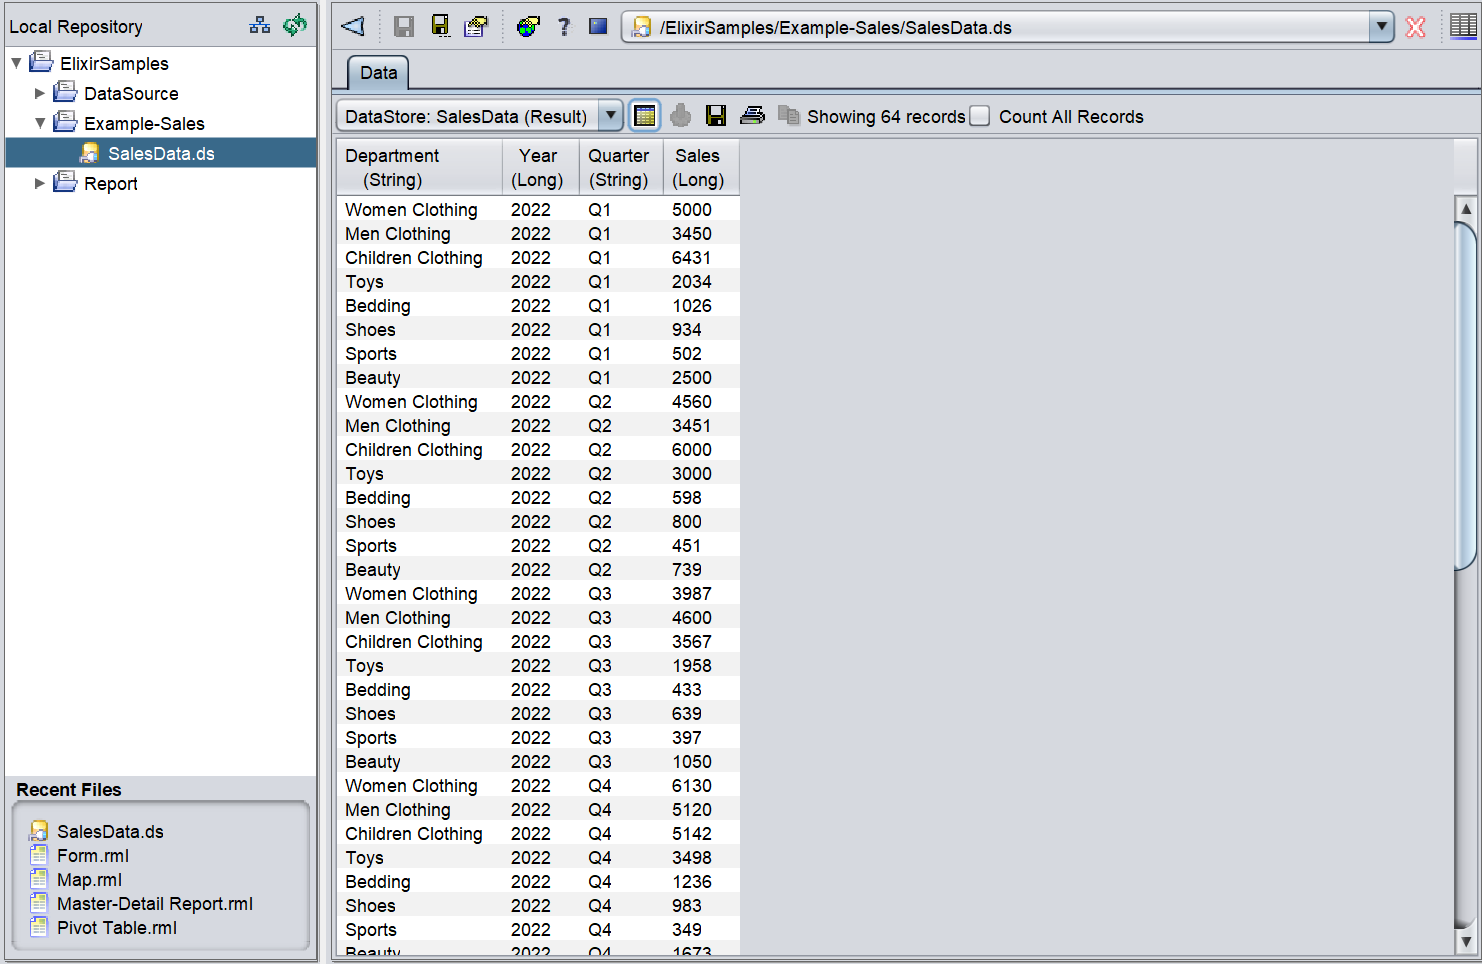
First, a datasource need to be created. This datasource will contain the mock-up sales data of a departmental store. In this example, an Excel file is used to store the data.
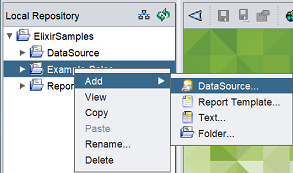
Next, add the Excel file into the Designer. To do so, select the desired folder and right click the mouse. In the pop-up menu, select the “Add” option and the “DataSource…” sub-option.
The “DataSource Wizard” dialog box will appear.
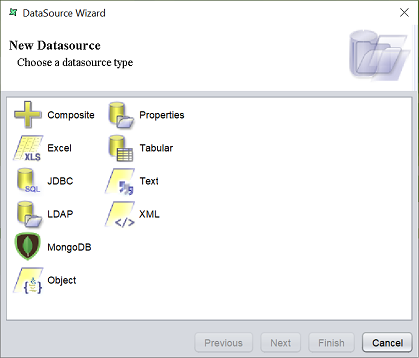
Select the “Excel” option and click on the “Next” button.
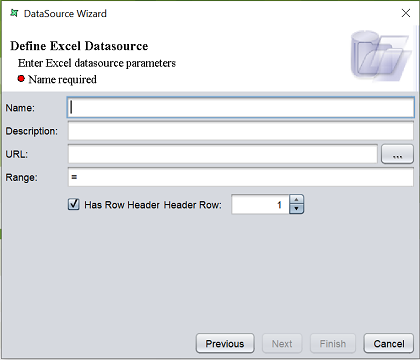
Key in a name for the datasource in the “Name” field. Click on the ‘…’ icon on the right of the “URL” field to browse to the location of the Excel file.
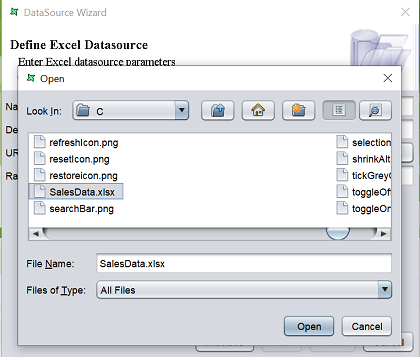
Click on the “Next” button to continue.
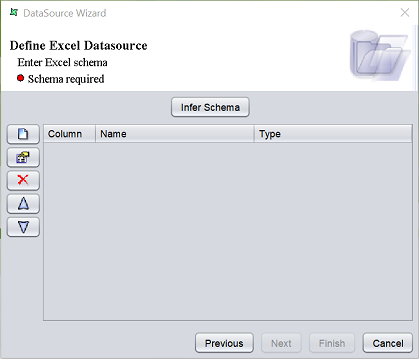
In the next page, click on the “Infer Schema” button. The list of fields will be listed in the table.
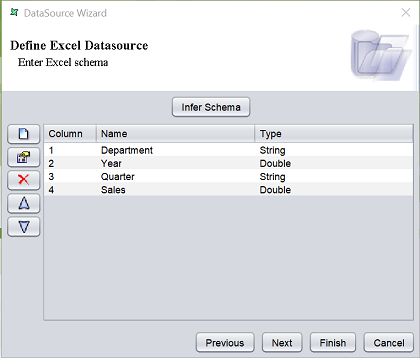
If any of the name or type is not desired, you can edit them by selecting the desired row and click on the “Edit” icon on the left. In this example, the field type of the “Year” and “Sales” fields are not correct. Long should be used instead. To change it to long type, select the last row and click on the “Edit” icon.
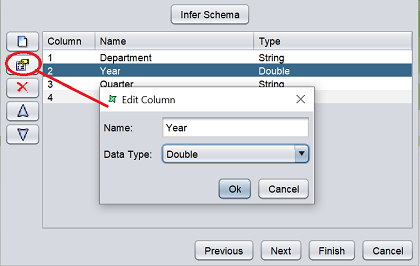
In the “Edit Column” dialog box, change the data type to “Long” and click on the “Ok” button to save the change. Click on the “Finish” button in the DataSource Wizard to save the datasource.
Once the datasource is created, it is opened in the workspace but the data is not loaded. To view the data, click on the “Load Data” icon.
Create RML Template
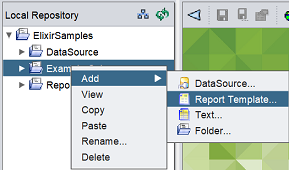
To create a RML template, select the desired folder and right click the mouse. In the pop-up menu, select the “Add” option and the “RML Template…” sub-option.
The “Report Wizard” dialog box will appear.
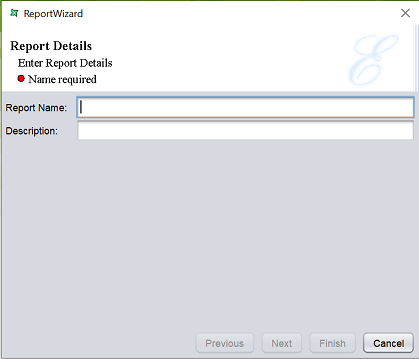
Key in an appropriate name for the report in the “Name” field and click on the “Next” button to continue.
The next page allows you to select a datasource.
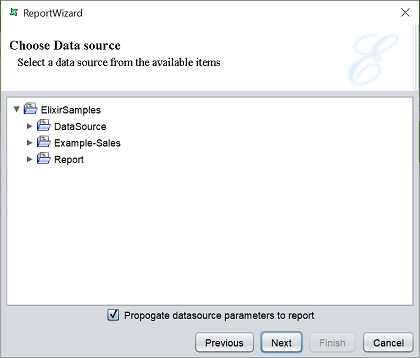
Select the desired datasource from the folders and click on the “Next” button to continue.
This page allows you to select the report type from the list of available options.
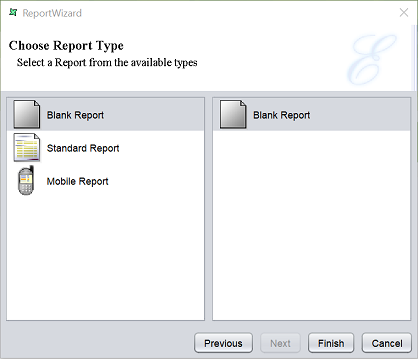
In this example, the report needs to generate a tabular table. Thus in the left panel, select “Standard Report” and in the options that appear, select “Tabular Report”.
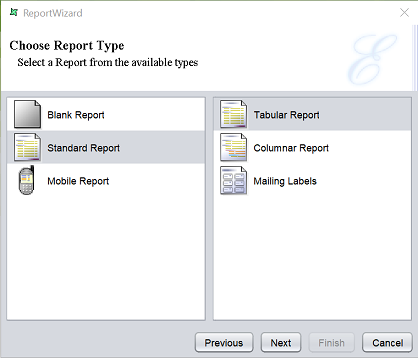
Click on the “Next” button to continue.
The next page shows two panels. The left panel shows all the fields from the datasource. The right panel shows the fields selected to be used in the report.
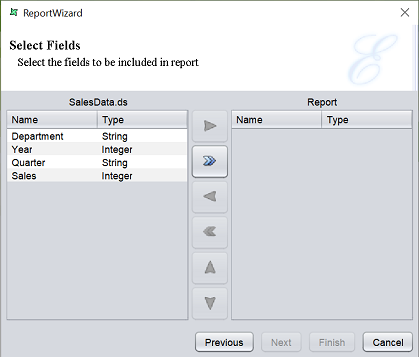
In this example, all fields are required. Click on the “All Fields” icon. Once the fields are added to the right panel, the “Next” and “Finish” buttons will be available.
Click on the “Finish” button to complete the creation of the RML template.
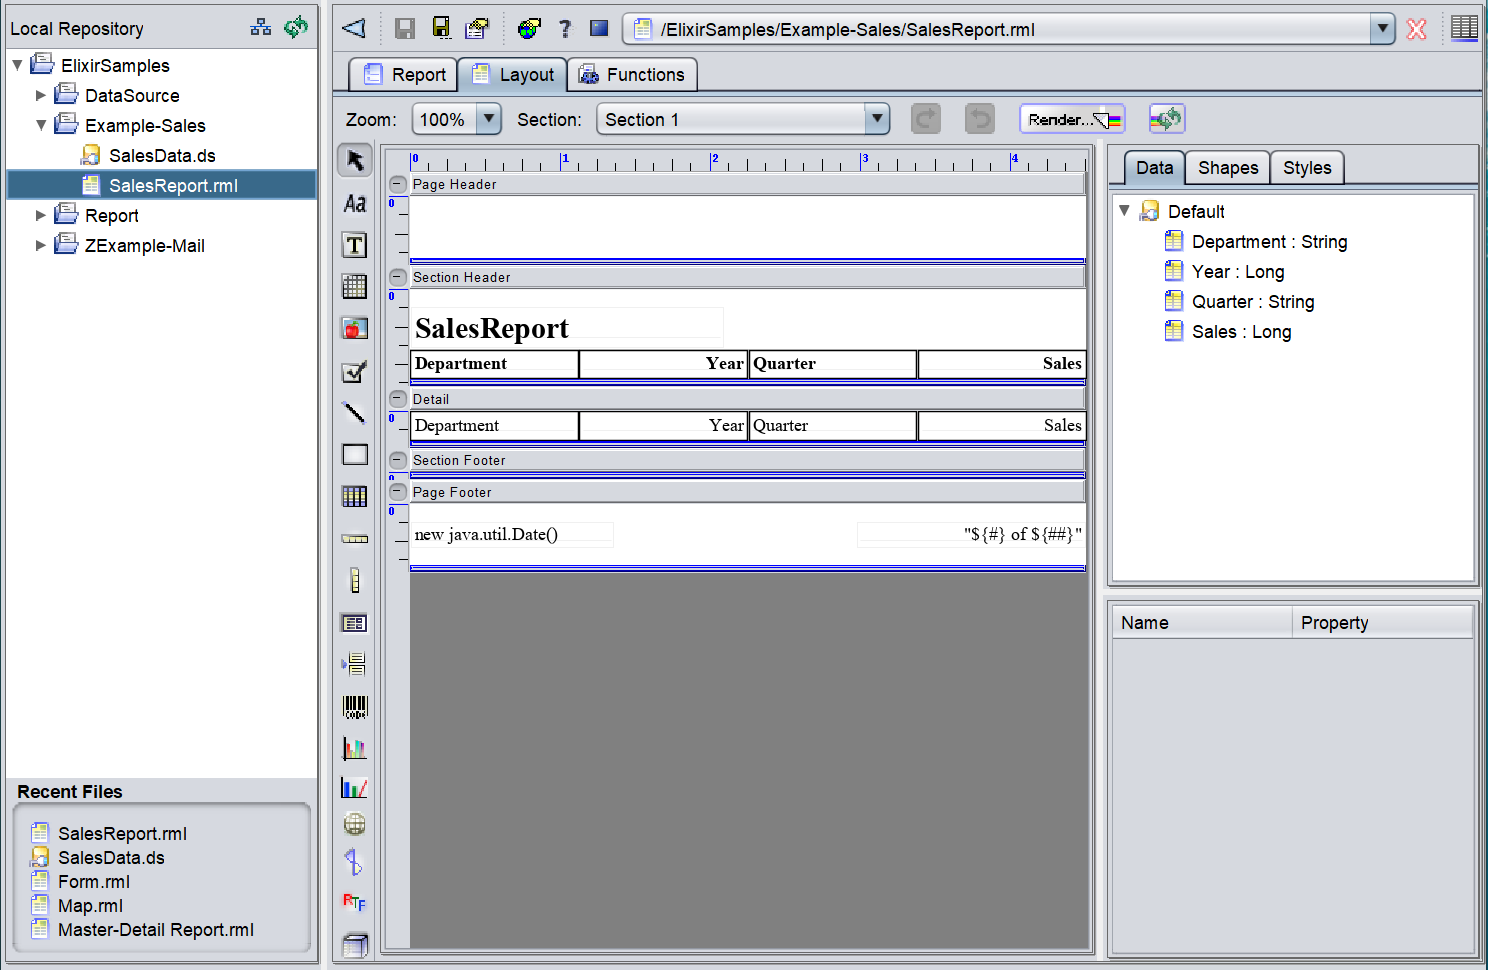
The report will open in the workspace.
Edit RML Template
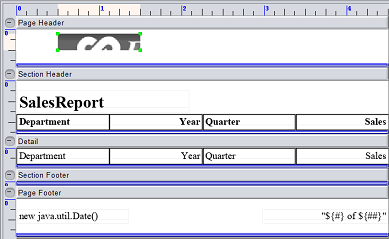
The RML report is divided into several parts, the Page Header, Section Header, Detail, Section Footer and Page Footer.
The Page Header in the report is by default empty.
The Section header contains the report title and the column names that corresponds to the column names in the datasource. The Section Footer is empty by default.
The Detail contains the report details.
The Page Footer contains the date of the report (when generated) and the page number of the report.
You can add an image onto the Page Header with the company’s logo (for example). As well as the alignment of the data in the columns.
Add Image
To add an image to the Page Header, select the  “Image” icon from the Report Elements on the left of the workspace. Click onto any space in the Page Header and the Image Wizard will appear.
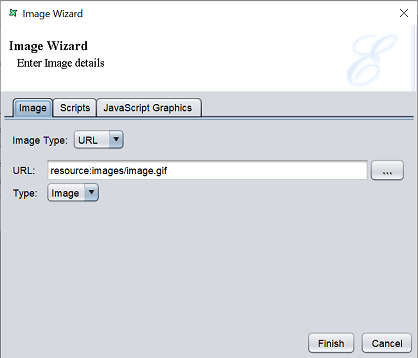
Click on the “…” icon on the right of the “URL” field and browse to the location of the image file. Click on the “Finish” button to add the image. The image is added onto the Page Header,
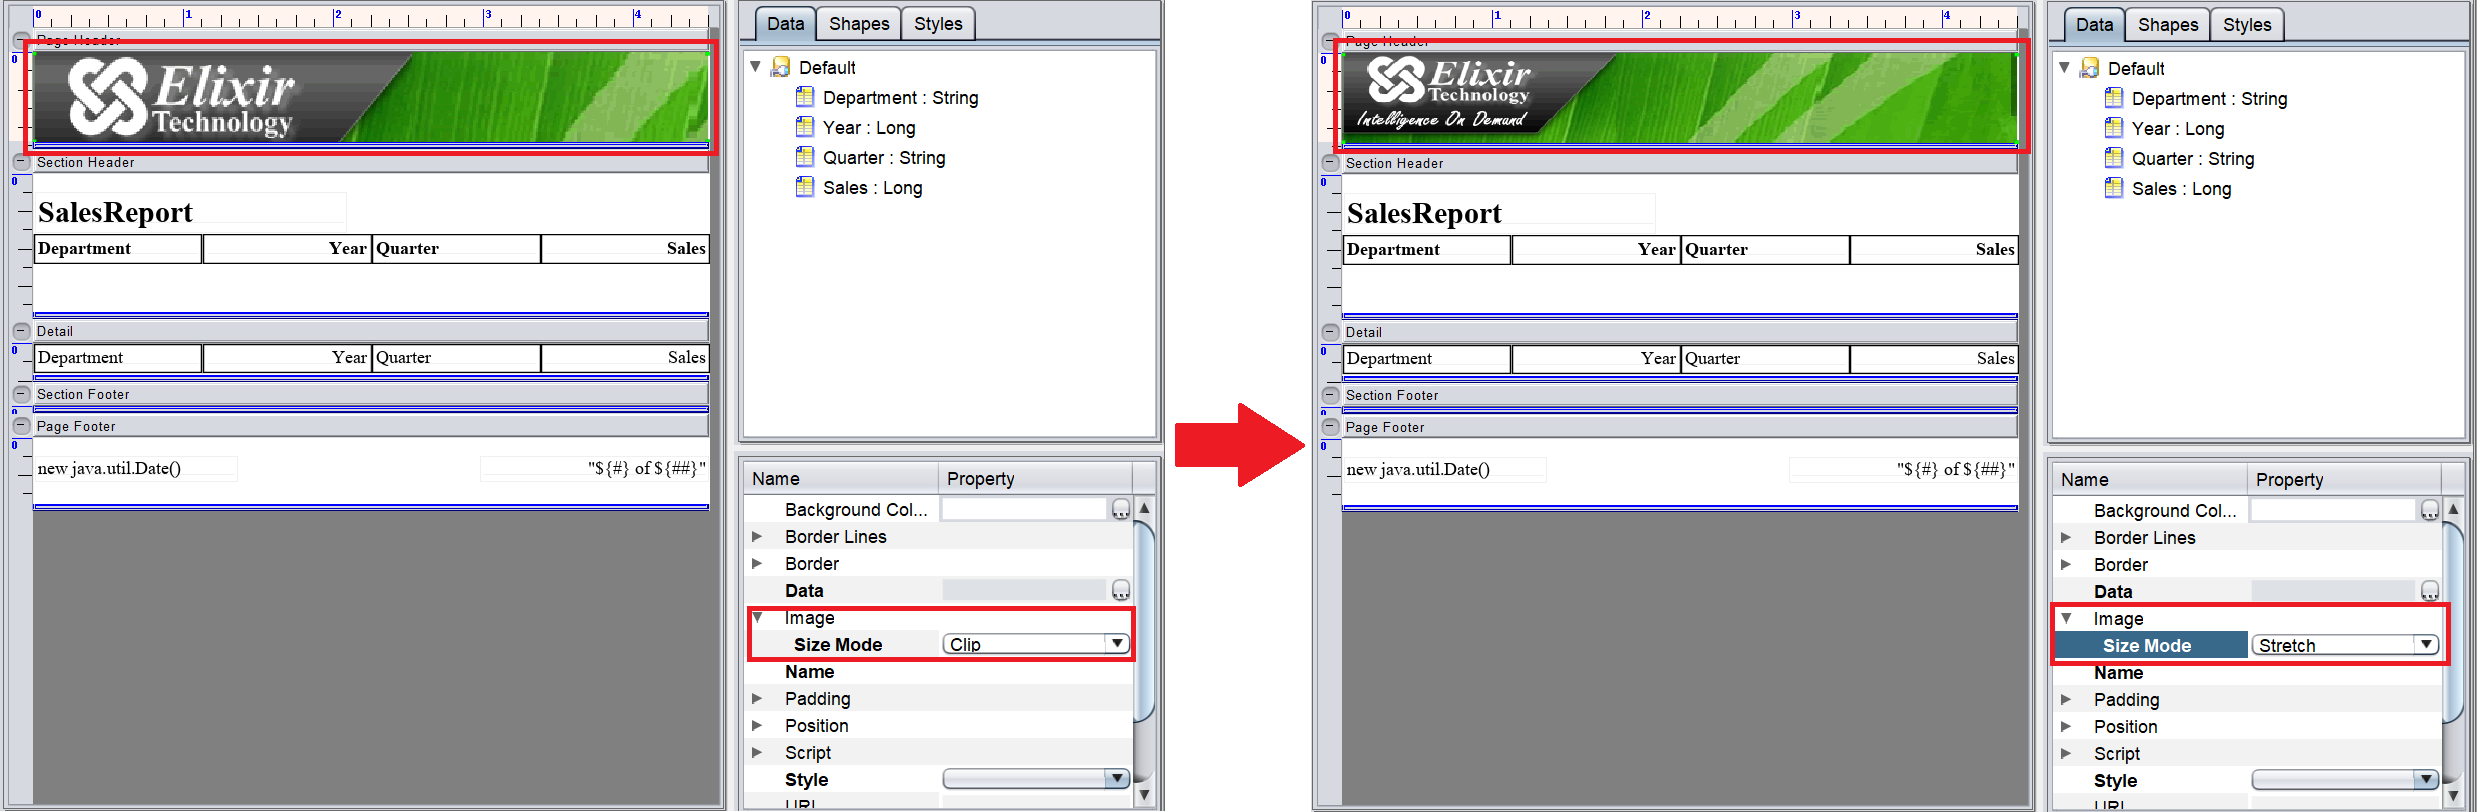
Drag and re-size the image to the desired location and size. The height of the Section Header can also be re-size by dragging the edge of the header. If the image does not fit properly or looks clipped, in the Properties Panel, select “Image” field to display its sub-field “Size Mode”. By default, “Clip” is selected. Select “Stretch” to fit the image onto the dragged size.
Edit Section Header
The Section Header contains the report title and the column names. These fields can be edited to have more suitable values.
Title
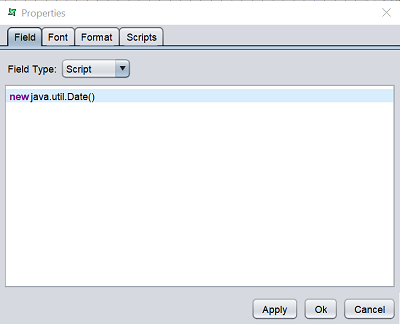
To edit the title field, double-click on the field itself and the “Properties” dialog box will appear.
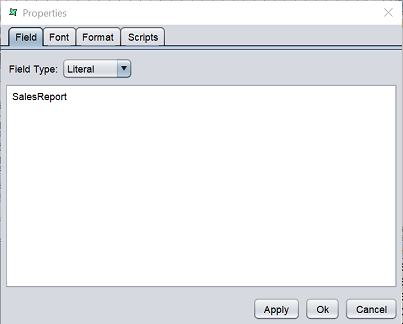
There are four tabs in the dialog box. Each tab allows you to edit different properties. In this case, two changes are made:
- In the Field tab, the title is changed to “Dept Sales Report”
- In the Font tab, the font is changed from 20 to 22
Click on the “OK” button to save the changes. The change is reflected directly in th workspace.
Column Name
The column names use the default alignment based on the field type, which may not be suitable for the report. The “Year” and “Quarter” will be more presentable if they are centre aligned.
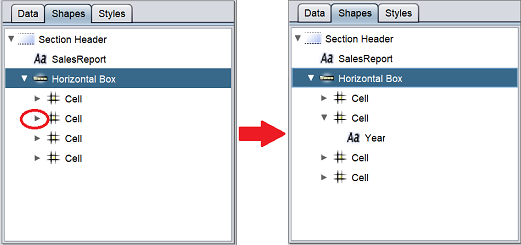
To edit the column name, select the column and select the “Shapes” tab from the Tree Panel.
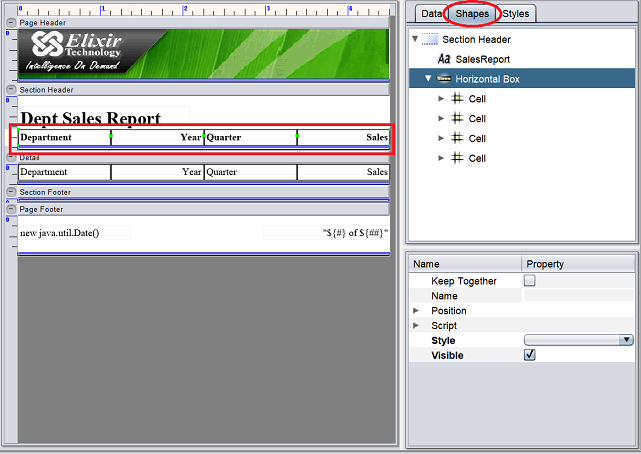
The “Shapes” tab shows the elements in the Section Header, in this case, a Text element and a Horizontal Box element with four cells. Each cell contains a Text element, which shows the column name. To view the Text element, click on the arrow icon on the left of the cell.
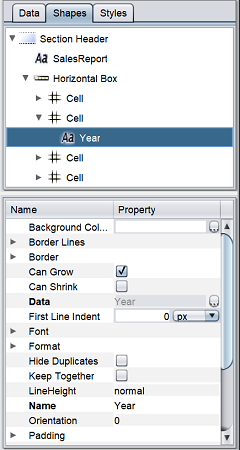
Select the Text element “Year” and the Properties Panel below will display its properties.
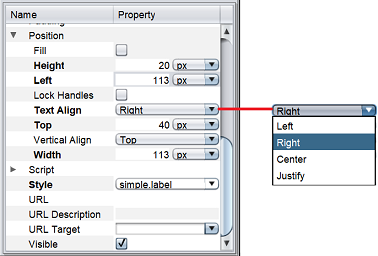
To make the “Year” column name centre aligned, scroll down and expand the “Position” properties. The “Text Align” sub-field shows that is it right-aligned. Select “Center” from the drop-down list.
Repeat the same for the “Quarter” column name.
Detail
The Detail part of the report displays the records in the datasource.
The columns should be aligned the same way the column names. Use the same method to change the alignment of the column names for the detail columns.
Page Footer
The Page Footer consists of the items:
- Date/time on the left of the page
- Page number on the right of the page
By default, both data and time are used. Most of the time, printing the date on the report is good enough, unless the report is time critical. To change the format of the date, double-click on the date itself and the “Properties” dialog box will appear.
Select the “Format” tab.
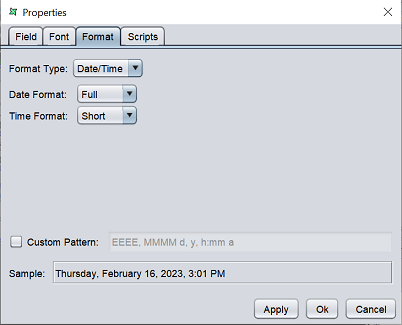
To remove the timestamp, select “None” from the drop-down list in the “Time Format” field. The “Sample” field will display the current format (i.e., without the timestamp). To change the date format, select the desired format from the drop-down list. View the selected format in the “Sample” field.
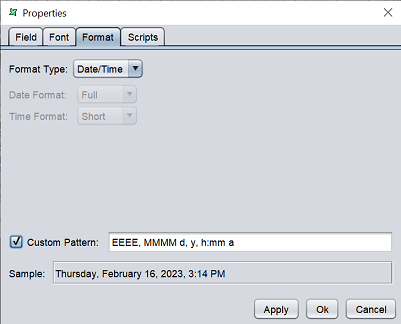
Alternatively, you can customise the date pattern. To do so, select the checkbox from the “Custom Pattern” field. The textbox on the right of the field will become editable and the “Date Format” and “Time Format” will be disabled.
| Type | Description |
|---|---|
| Day of week | Represented by “E”. - One “E” shows short format - “EEEE” shows full format E.g., “E” shows “Thu” while “EEEE” shows “Thursday”. |
| Month | Represented by “M”. - One “M” shows single numeric value of month - “MM” shows two numeric value of month - “MMM” shows short format of month - “MMMM” shows full name of month E.g., “MM” shows “06” while “MMMM” shows “June”. |
| Day | Represented by “d”. - One “d” shows numeric value of day |
| Year | Represented by “y”. - One “y” shows numeric value of year in full - “yy” shows last two numeric value of the year |
| Hour | Represented by “h” (for 12-hour format) or “H” for (24-hour format). - One “h” or “H” shows numeric value of hour time |
| Minute | Represented by “mm”. “mm” shows numeric value of minute time. |
| AM/PM marker | Represented by “aa”. “aa” shows AM/PM marker. This value should not be used if the 24-hour time is used. |
Key in the desired format and the “sample” field will show the format entered.
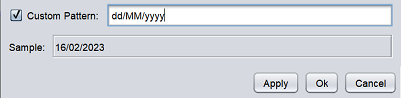
Click on the “Ok” button to save the changes. When the report is rendered, the new date will be displayed.
Generate Report
To generate the report, click on the  “Render…” button at the top bar.

The “Render Wizard” will appear.
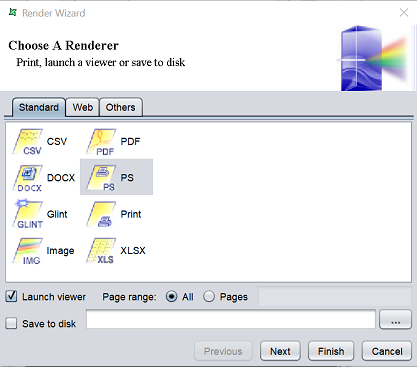
Select the desired output type and click on the “Next” button to cotinue. The next page allows you to change the default settings of the output type selected. If there are no settings, the page will be empty. Click on the “Finish” button to generate the report.
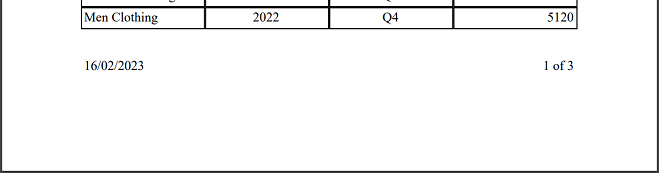
Below is an exanple of a PDF output format of the RML report.
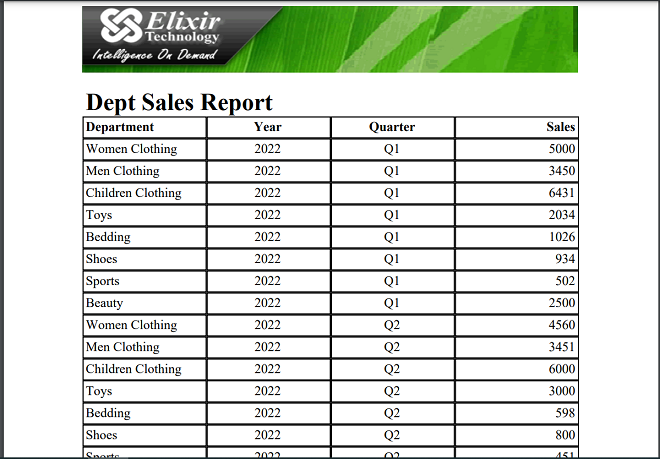
At the bottom of the each page of the report, the current date and page number is also generated.