
Cube Table
The  Cube Table element allows two-dimensional cubes to be embedded in a report.
Each cube has two dimensions, one representing the table rows and one the columns. Each dimension may consist of multiple levels, defined by data fields. The records are grouped by these levels and those records forming the intersection of the row and column levels are rendered using one or more cube measures (e.g., Sum or Average).
Add Cube Table
To add a cube table onto the report, select the “Cube Table” button and click onto the location in the report where the cube table is to be placed. A “Cube Table Wizard” will appear.
There are three tabs in this wizard.
- Cube - Allows you to select the datasource to be used and setup the cube table
- Font - Allows you to setup the font type, size, style, as well as the colour
- Scripts - Allows you to add Java scripts
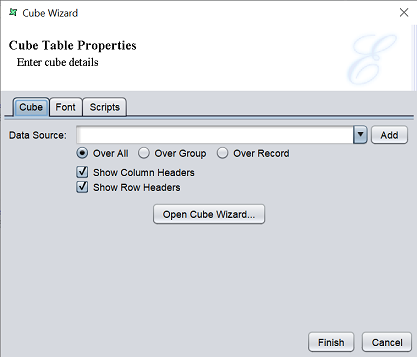
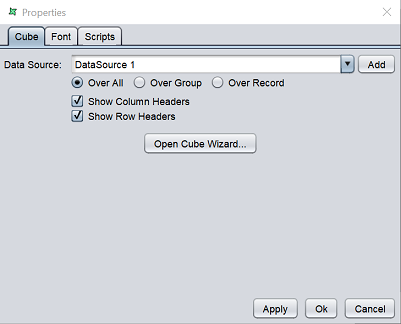
Cube Tab
The “Cube” tab allows you to select the datasource to be used and sets up the cube table.
In the “Cube” tab, it has the following fields.
| Field | Description |
|---|---|
| Data Source | Selects a datasource. Either from drop-down list or click on the “Add” button to add a datasource from repository. |
| Over All | If selected, whole set of records are taken ito consideration irrespective of the grouping. by default, it is selected. |
| Over Group | If selected, plotting is done based on the grouping of data is considered. |
| Over Record | If selected for the cube table in the group header, the first record of the group is considered. If selected for the cube table in the group footer, the last record of the group is considered as current record. If selected for the section header, then the first record if the datasource is considered. |
| Show Column Headers | If selected, shows the column headers in the cube table. By default, it is selected. |
| Show Row Headers | If selected, shows the row headers in the cube table. By default, it is selected. |
Select the desired datasource and select the range of records to be used. By default the column and row headers are selected. Click on the “Open Cube Wizard”.
Cube Wizard
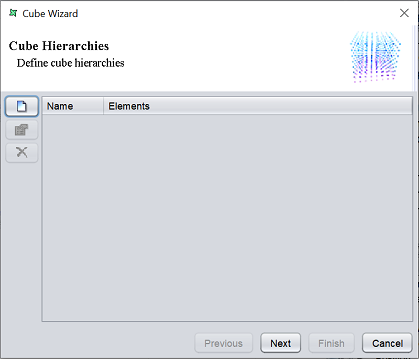
In this page, the cube hierarchies are to be defined. There are three button on the left, which allows you to add, edit and delete a hierarchy respectively.
To add a hierarchy, click on the “Add” button on the left. A “Add Hierarchy” dialog box will appear.
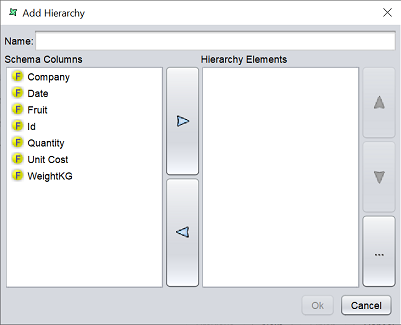
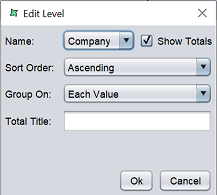
In the “Name” field, key in a name for this hierarchy. In the “Schema Columns” panel, select the desired field and move it to the “Hierarchy Elements” panel. You can edit the properties of the field by clicking on the “…” button on the right. In the “Edit Level” dialog box, you can edit the fields below.
| Field | Description |
|---|---|
| Name | Selects the field from the drop-down list. |
| Show Totals | If selected, shows the total of selected field. |
| Sort Order | Selects the sort order of the field data. - None - Ascending (default) - Ascending (Simple) - Descending - Descending (Simple) |
| Group On | Selects how the data is grouped. Available options: - None - Each Value (default) - Substring - Range - All - Count |
| Total Title | Defines the title. |
If “Substring”, “Range” or “Count” is selected for “Group On” field, a textbox will appear after “Total Title” field. It allows you to key in the desired value for the relevant option. Click on the “OK” button once all relevant settings are completed.
After all required hierarchies are added, click on the “Next” button.
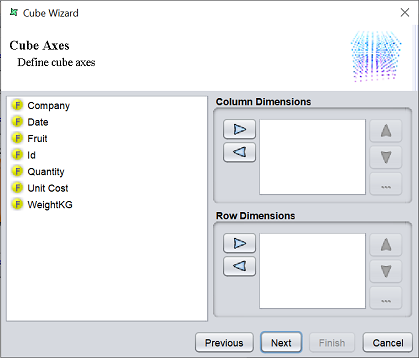
In this page, you can add the column and row dimensions. The elements that are added in the Column Dimensions panel will be displayed as the column fields in the output table. The elements that are added in the Row Dimension panel will be displayed as the row fields in the output table.
The hierarchy column added in the first page can be made use of in this screen as a row or column field. Use of a hierarchy is more efficient, as the system relies on the strict definition of each child only having one parent. However, an incorrect use of the hierarchy, will usually yeild incorrect results.
Add the desired fields to the Column Dimensions and Row Dimension panels and click on the “Next” button to continue.
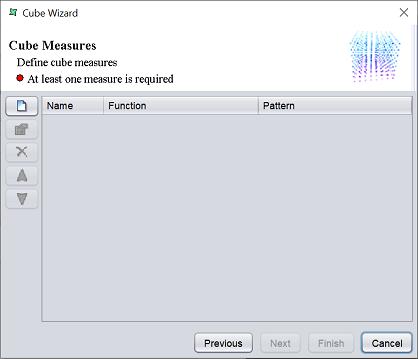
In this page, the cube measures are defined. On the left of the page, there are several buttons, which allows you to add, edit, delete, move uo and move down respectively.
To add a cube measure, click on the “Add” button. A “Add Measure” dialog box will appear.
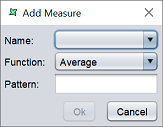
| Field | Description |
|---|---|
| Name | Selects the field from the drop-down list. |
| Function | Selects the function for the field from the drop-down list. |
| Pattern | Defines the column name. If left blank, the default column name is used. |
Select the desired field from the “Name” field and select the desired function in the “Function” field. To use the default field name, leave the “Pattern” field blank, otherwise, key in a name for the field in the textbox. Click on the “OK” button to save the new measure.
Repeat the above until all required measures are added. Click on the “Next” button to continue. Or click on the “Finish” button to use the default setting for the cube record output options.
This page allows you to setup the cube record output options.
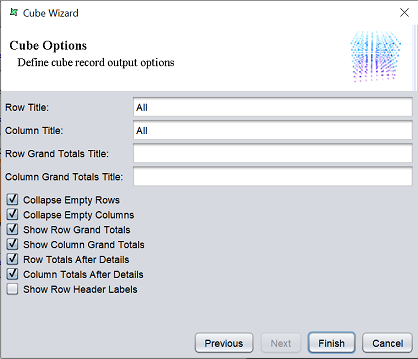
It has the following fields:
| Field | Description |
|---|---|
| Row Title | |
| Column Title | |
| Row GRand Totals Title | |
| Column Grand Totals Title | |
| Collapse Empty Rows | Removes any rows from the cube that have no records contributing to them. If empty records are not collapsed the output will be a permutation of non-hierarchical row dimensions. Hierarchies by definition do not have empty rows. By default, it is selected. |
| Collapse Empty Columns | Removes any column from the cube that have no records contributing to them. Do note that using this option will alter the output schema, the columns indicate the fields each record will contain. Care should be taken when using this option as errors will result if subsequent steps depend on the presence of columns that are removed. By default, it is selected. |
| Show Row Grand Totals | Shows the row grand total of all rows in the same column. By default, it is selected. |
| Show Column Grand Totals | Shows the column total of all columns in the same row. By default, it is selected. |
| Row Totals After Details | If selected, shows the sum the total after the row(s) of each group of measure(s). By default, it is selected. |
| Column Totals After Details | If selected, shows the sum the total before each group of measure(s). By default, it is selected. |
| Show Row Header Labels | If selected, displays the row header labels. By default, it is not selected. |
Setup the output options are desired and click on the “Finish” button to complete setting up the cube table.
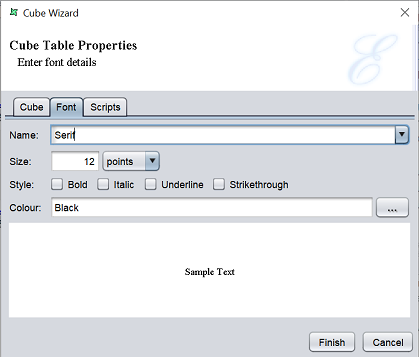
Font Tab
In the “Font” tab, it has the following fields.
| Field | Description | Type |
|---|---|---|
| Name | Selects the font name. Default value is “Serif”. |
Drop-down list |
| Size | Selects the font size. Default value is 12, default unit is pixels. |
Textbox, drop-down list |
| Style | Selects the style of the font. More than one can be selected. Available options: - Bold - Italic - Underline - Strikethrough |
Checkbox |
| Colour | Selects the colour of the font. Default value is “Black”. |
Textbox |
Select the desired font, size and style from the “Name”, “Size” and “Style” fields respectively. To choose the colour for the font, either key in the name of the colour or click on the  button on the right. A “Choose Colour” dialog box will appear.
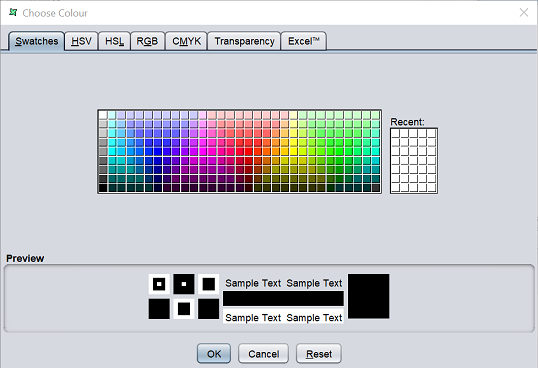
Select the desired colour from the tabs and select the transparency in the “Transparency” tab. The selected colour and transparency is displayed in the “Preview” panel below the colour palette. To clear the colour selected, click on the “Reset” button. The default colour will appear in the “Preview” panel, which is black. Click on the “OK” button to save the colour selected.
Scripts
This tab has three panels which allows you to add Java scripts:
- Render If
- On Render Begin
- On Render End
The JavaScript functions that are entered in these text boxes are executed when the cube table is rendered.
Edit Cube Table
To edit a cube table in the report template, click on the Cube Table element to display the “Properties” dialog box.
The three tabs in the dialog box is the same as those in the Cube Wizard.