
Map
The  Map element allows you to add a map onto the report.
Add Map
To add map onto the report, select the “Map” button and click on the location where you wish to place the map. A “Map Wizard” will appear.
There are three tabs in this wizard:
- Map
- Scripts
- JavaScript Graphics
Map Tab
The “Map” tab allows you to define the path of the map image.
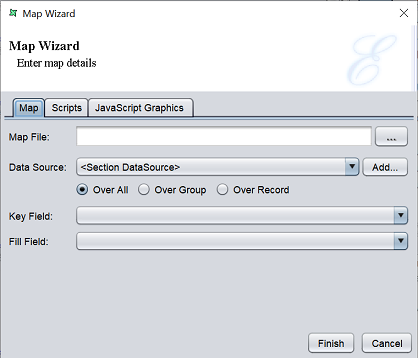
| Field | Description |
|---|---|
| Map File | Defines the path to the map file in the repository. |
| Data Source | Selects a datasource. Either from drop-down list or click on the “Add” button to add a datasource from repository. |
| Over All | If selected, whole set of records are taken ito consideration irrespective of the grouping. by default, it is selected. |
| Over Group | If selected, plotting is done based on the grouping of data is considered. |
| Over Record | If selected for the cube table in the group header, the first record of the group is considered. If selected for the cube table in the group footer, the last record of the group is considered as current record. If selected for the section header, then the first record if the datasource is considered. |
| Key Field | Selects a field as the key field. |
| Fill Field | Selects a field as the fill field. |
Select the map file from the repository by clicking on the  button or key in the path in the textbox. In the “Datasource” field, select the desired datasource from the drop-down list or select one from the repository by clicking on the “Add” button. Select one of the three options for the range of records to be used. By default, “Over All” is selected. In the “Key Field” field, select a field from the drop-down list as the reference field. In the “Fill Field” field, select a field from the drop-down list as the field used to fill by the map.
Scripts Tab
This tab has three panels which allows you to add Java scripts:
- Render If
- On Render Begin
- On Render End
The JavaScript functions that are entered in these text boxes are executed when the map is rendered.
JavaScript Graphics Tab
This tab allows you to add JavaScript for the image.
Edit Map
To edit the map in the report template, double-click on the Map element to display the “Properties” dialog box.
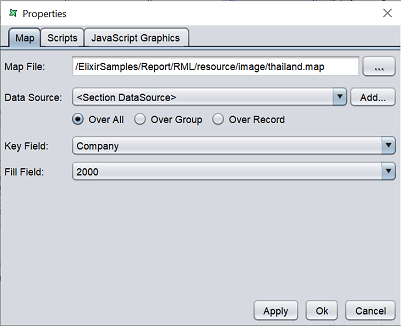
The three tabs in this dialog box is similar to the Map Wizard.