
Table
The  Table element allows you to view data in a table.
A table consists of three parts, the header, body and footer. The datasource fields are placed inside the body while the headers can contain column headings, etc. Similarly, footers can also contain any other related details. When a table is rendered, it fetches the table datasource and renders one table row for each record in that datasource. The fields of the section datasource will remain constant as the table is iterating through the records in its datasource, without incrementing the section record index.
Add Table
To add a table in the report, select the “Table” button and click on the location where the table is to be placed in the report. A “Table Wizard” will appear.
There are three tabs in the wizard:
- Table - Allows you to select the datasource and the range of records to display
- Select Fields for Table - Allows you to select the fields to display
- Scripts - Allows you to add Java sctipts for “Render If”, “On Render Begin” and “On Render End”
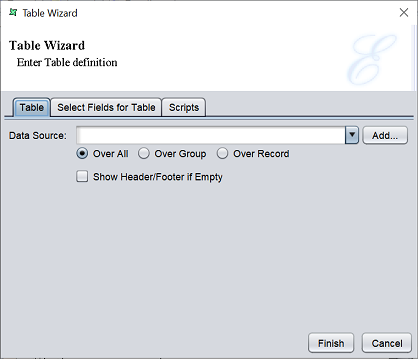
Table Tab
In the “Table” tab, select the desired datasource from one of the two methods:
- From the drop-down list
- Click on the “Add” button and select the desired datasource from the repository
Select one of the three options for the range:
- Over All (default) - All records in the datasource are used
- Over Group - Records will be added starting with the current record index, up to the next end of a group
- Over Record - Only current record is used
Select the “Show Header/Footer if Empty” field if you wish to display just the header and footer even when no records are populated in the table body. This field is not selected by default.
Select Fields for Table Tab
In the “Select Fields for Table” tab, once a datasource is selected in the “Table” tab, the fields in the datasource will appear in this tab. If no datasource is selected, this tab will be empty.
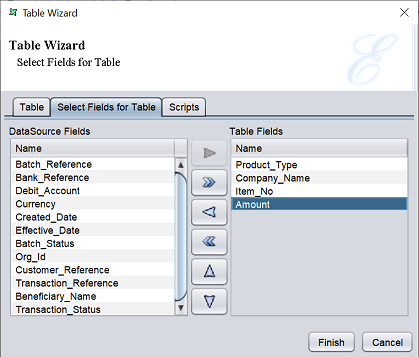
This page is divided into three parts. On the left is the “DataSource Fields” panel where all fields from the datasource are displayed. On the right is the “Table Fields” panel where the fields to be used for the table is listed. By default it is empty. At the centre is a column of buttons, which allows you to move the fields to and fro the two panels and arrange the order of the fields in the “Table Fields” panel. By default, only the “Move All Right” button is enabled at the centre (without selecting any field).
If all fields are to be to be used, simply click on the “Move All Right” button at the center (enabled by default). To move one field at a time, select the desired field from the “DataSource Fields” panel and click on the “Move Right” button at the centre to move the field to the “Table Fields” panel. You can move a field back to the “Datasource Fields” panel by selecting it and click on the “Move Left” button.
The order of the fields in the “Table Fields” panel determines how the table is displayed. You can arrange the fields in the panel by selecting the desired field and click on the “Move Up” or “Move Down” button.
Scripts Tab
This tab has three panels which allows you to add Java scripts:
- Render If
- On Render Begin
- On Render End
The JavaScript functions that are entered in these text boxes are executed when the image is rendered.
Edit Table
To edit the Table element in the report template, double-click on the Table element to display the “Properties” dialog box.
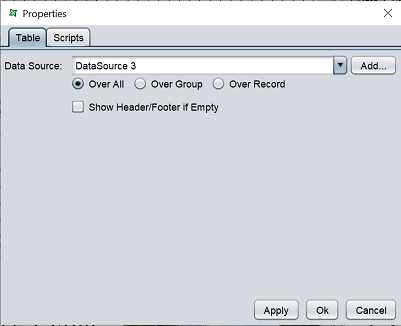
The two tabs in the dialog box is similar to the first and last tabs of the Table Wizard.