
Dashboards Management
Description
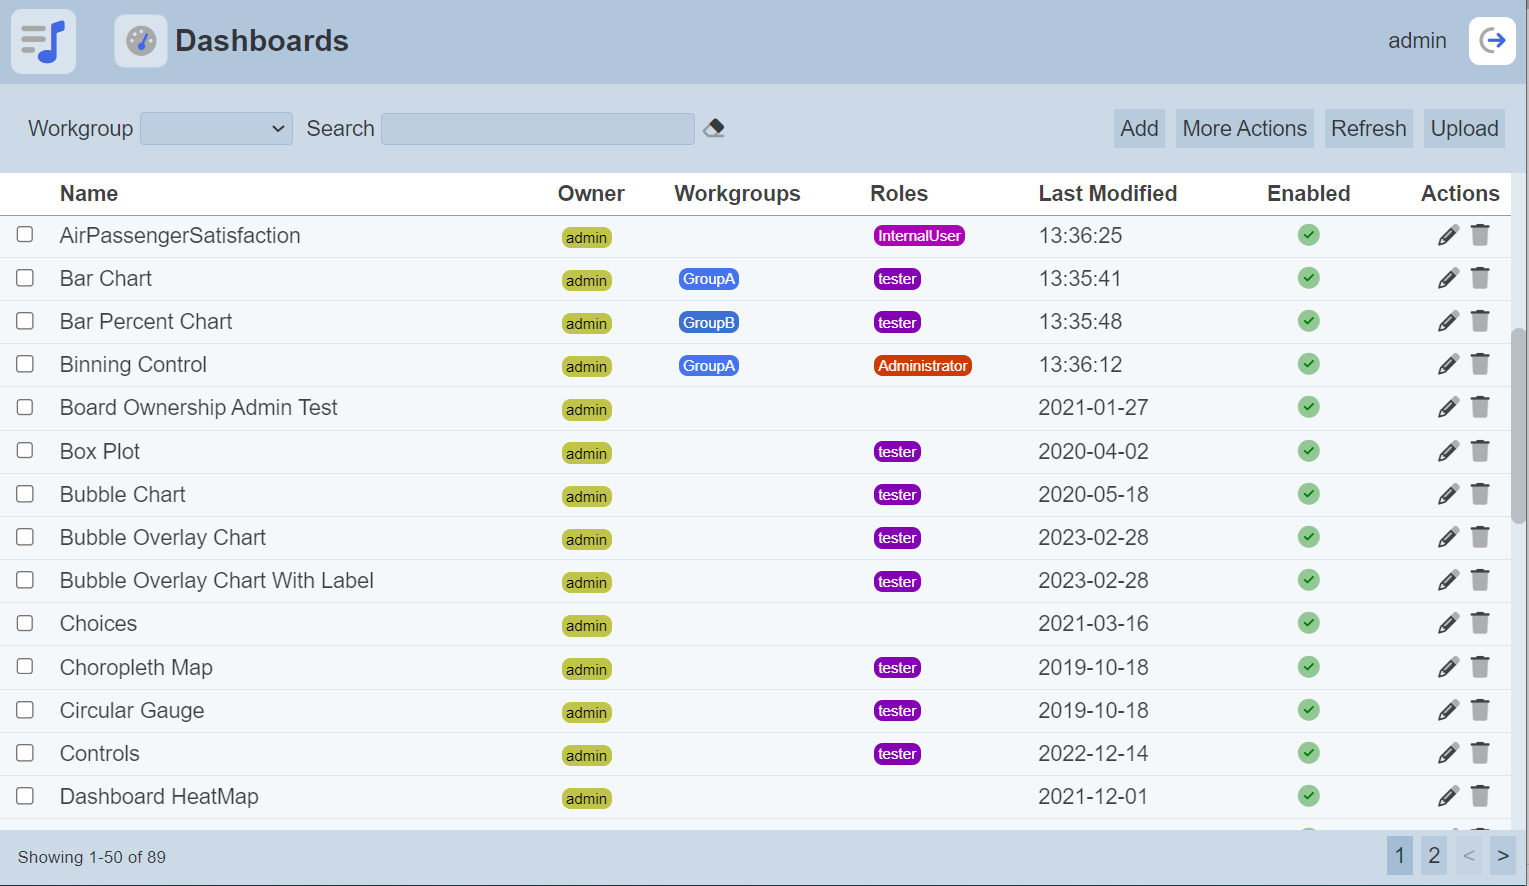
Dashboards management page provides an interface to manage dashboard properties. Users can add, modify and delete dashboards here. This interface also leads to the dashboard designer and viewer. Uploading and downloading dashboards are also supported. Controlling the audience of the dashboard is also managed through this interface.
Add Dashboard
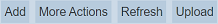
To add a new dashboard, start by clicking on the “Add” button on the upper right corner of the page.
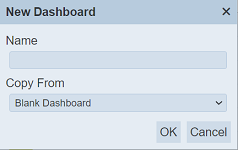
A dialog box prompting the user to key in the new dashboard’s name is displayed. The user also has the option to copy another dashboard (all components including pages, views, controls) and use it as a starting point.
| Field | Description | Mandatory | Input Type | Constraints | Default Value |
|---|---|---|---|---|---|
| Name | Unique name assigned to the dashboard that would be used as its identifier. | Y | Text field | Any text. The value must not exist in the current list of names, regardless of status (enabled or disabled) and ownership. The value is case-sensitive. | Empty string |
| Copy From | Indicates what template the dashboard would be based on. Selecting “Blank Dashboard” results in using a blank canvass as a starting point while selecting an existing dashboard would result in having the selected dashboard as the starting template. | Y | Select | One value can be selected. Options are: - “Blank Dashboard” - names of all enabled dashboards the user currently has read access to |
“Blank Dashboard” |
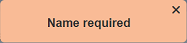
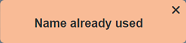
If the “Name” field is left empty or the name keyed in is already used, the relevant error message will appear when attempt to save the dashboard.
Note that in copying another dashboard, any change made to the dashboard in the “Copy From” would not be applied to the new dashboard after its creation. Copying does not link any of the dashboards.
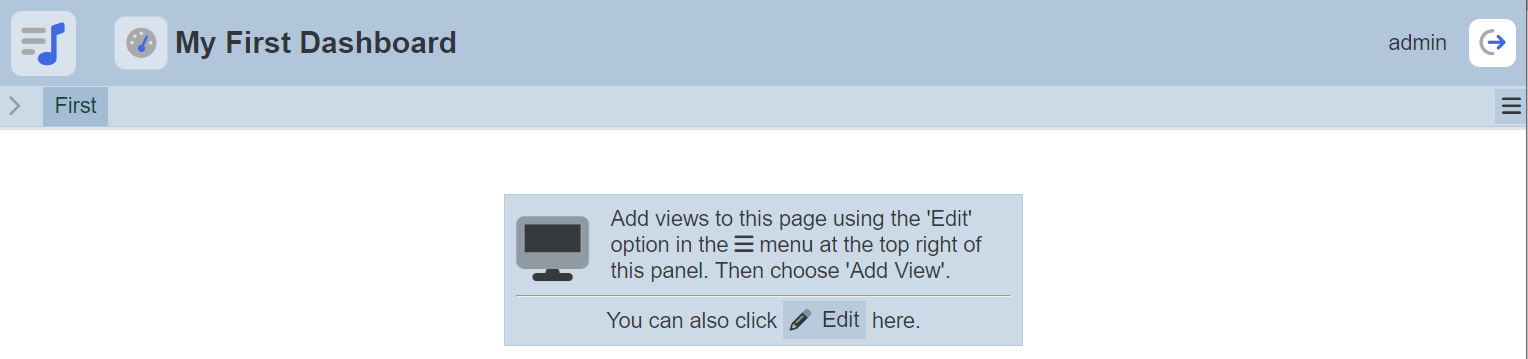
Clicking on the “OK” button on the dialog above redirects the user to the Dashboard Viewer, rendering the newly created dashboard with one page, entitled “First”. Clicking on the “Cancel” button aborts the action.
Do note that if an option is selected from the drop-down list for the “Workgroup” field at the top of the page, any dashboard added to the management page will have the selected workgroup added to it. For example, if “Workgroup A” is selected, a new dashboard “Dashboard XYZ” is added. “Dashboard XYZ” will have “Workgroup A” added to its properties.
Edit Dashboard
To modify an existing dashboard’s attributes, click on the  “Edit” icon under the “Actions” column corresponding the said dashboard.

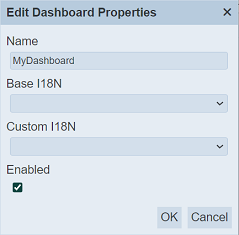
The “Edit Dashboard Properties” dialog box displays the selected dashboard’s attributes.
| Field | Description | Mandatory | Input Type | Constraints | Default Value |
|---|---|---|---|---|---|
| Name | Unique name assigned to the dashboard that would be used as its identifier. | Y | Text field | Any text. The value must not exist in the current list, regardless of status (enabled or disabled) and ownership. The value is case-sensitive. | Empty string |
| Base I18N | Selects the default I18N translation. | N | Drop-down list | Translations need to be setup in the Internationalisation module. | Not selected |
| Custom I18N | Selects the custom I18N translation. | N | Drop-down list | Translations need to be setup in the Internationalisation module. | Not selected |
| Enabled | Indicates if the dashboard is enabled (selected) or disabled (unselected). | Y | Checkbox | True (selected) or false (unselected) | True (selected) |
Edit the properties of the dashboard as desired and click on the “OK” button to save the changes.
Refer to Internationalisation for more details on how to internationalise a dashboard.
Do note that if you are not the owner of the dashboard, the icon will not appear, hence you will not be able to edit the dashboard.
Enable and Disable Dashboard
Disabling a dashboard temporarily makes it unavailable for all allowed read users. Enabling and disabling a dashboard can be done through editing an existing dashboard.
To enable a disabled dashboard, select the “Enabled” checkbox in “Edit Dashboard Properties” dialog box then save.
Similarly, deselect the checkbox to disable an enabled dashboard. Disabling a dashboard also disables using it with both the Dashboard Viewer and Dashboard Designer interfaces.
Alternatively, enable or disable an existing dashboard through the “Set Enabled True” or “Set Enabled False” options under the “More Actions” menu.
Open Dashboard
Click on the name of the dashboard under the “Name” column to open the dashboard.
The Dashboard Designer is accessed through the Dashboard Viewer.
More details on the two interfaces can be found below:
Upload Dashboard
Clicking on the “Upload” button on the upper right corner of the interface prompts the user to upload a JSON (.json) file.
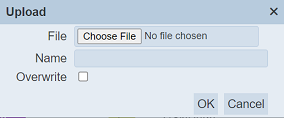
Single File
Browse to the location of the dashboard JSON (.json) file to be uploaded. For the “Name” field, the same constraints for “Name” in the add dashboard dialog are applied to the “Name” field here. Verification on name uniqueness is not applied if “Overwrite” is selected.
After clicking on the “OK” button on the upload dialog, a record of a new dashboard is uploaded (new name given) or an existing dashboard with the same name (existing name with “Overwrite” selected) is updated. An message will appear if the name already exist and the overwrite checkbox is not selected.
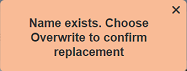
Clicking on the “Cancel” button aborts the action.
Upon successful uploading, the relevant message will appear.
Zip File
Browse to the location of the zip file to be uploaded. The name of the dashboards will be extracted from the zip file. Click on the “OK” button to upload the dashboards. The “Upload Results” dialog box will display the results of the uploading.
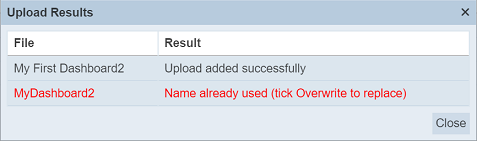
Those results in black are uploaded successfully while those in red indicates upload failures with their relevant messages. Click on the “Close” button to close the dialog box.
Delete Dashboard
Deleting a dashboard removes it from the records, which means another dashboard with the same name as the deleted one can be added.
To delete an existing dashboard from Ambience, click on the  “Delete” icon under the “Actions” column corresponding the said user.
There is an option to undo the deletion. A notification with an “Undo” button appears right after clicking on the “Delete” icon.
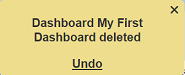
Upon clicking on the “Undo” button, the deleted dashboard is restored and is added back to the list of dashboards.
Do note that if you are not the owner of the dashboard, the icon will not appear under the “Actions” column.
More Actions
This feature allows user to perform actions on multiple dashboards at the same time.
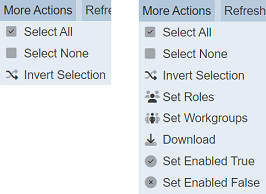
When the “More Actions” button located at the upper right corner of the page is clicked, a list of available actions are displayed.
If no dashboard is selected prior clicking the button, there will be fewer actions available. To select a dashboard, select the checkbox next to the name of the dashboard.
| Option | Description |
|---|---|
| Select All | Selects all dashboards in the list. |
| Select None | Unselects all dashboards. |
| Invert Selection | Inverts the current selection. That is, any dashboards selected will be unselected and vice versa. |
| Set Roles | Selects the roles to be assigned to the dashboards. |
| Set Workgroups | Selects the workgroups to be associated with the dashboards. |
| Download | Downloads multiple dashboards as a zip file. If only one dashboard is selected, the selected dashboard will be downloaded as a JSON file. |
| Set Enabled True | When selected, sets the selected dashboards to enable. |
| Set Enabled False | When selected, sets the selected dashboards to disable. |
Set Roles
To set the roles for the selected dashboards, click on the “More Actions” button and select the “Set Roles” option. The “Set Roles” dialog box will appear.
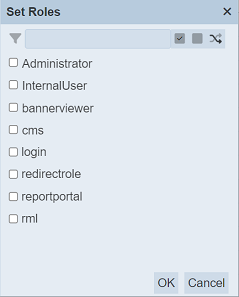
Select the roles to have access to the dashboard by selecting the checkboxes. Alternatively, you can search for the desired role by keying in the keyword in the search function at the top of the dialog box. You can also choose to select all, select none or invert selection by clicking on their respective icons on the right of the search function.
Click on the “OK” button to save the changes or click on the “Cancel” button to abort the action.
Set Workgroups
To set the workgroups to be associated with the selected dashboards, click on the “More Actions” button and select the “Set Workgroups” option. The “Set Workgroups” dialog box will appear.
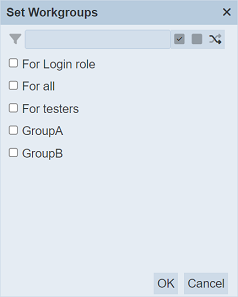
Select the workgroups to be associated with the dashboards by selecting the checkboxes. Alternatively, you can search for the desired workgroup by keying in the keyword in the search function at the top of the dialog box. You can also choose to select all, select none or invert selection by clicking on their respective icons on the right of the search function.
Click on the “OK” button to save the changes or click on the “Cancel” button to abort the action.
Do note that the available options that appear in the list, the user is either owner of the workgroups or is assigned a role listed in the workgroups. If the user is not the owner of any workgroup or not assigned any of the roles in a workgroup, no options will appear in the “Workgroups” property panel.
Download
To download the selected dashboards, click on the “More Actions” button and select the “Download” option.
If only one dashboard is selected, the downloaded dashboard has a filename of <filename>.dashboard.json.
If more than one dashboard are selected prior, the “Download” dialog box will appear.
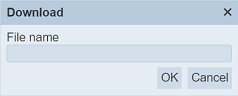
Key in the desired name for the zip file and click on the “OK” button. The selected dashboards will be downloaded as a zip file with the filename provided earlier. The individual dashboard in the zip file will have the filename format as mentioned above.
Set Enabled True / False
To enable or disable the dashboards, click on the “More Actions” button and select the “Set Enabled True” or “Set Enabled False” option respectively.
The selected dashboards will be enabled or disabled as selected.
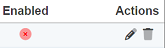
An enabled dashboard is represented with a green tick under the “Enabled” column, while a disabled dashboard is represented with a red cross.
Refresh List
After performing actions (e.g. add dashboard, delete dashboard) on the browser window/tab, the list is reloaded to display the updated data. The manual “Refresh” button is available and is particularly useful if there are others making changes on the same page.
The “Refresh” button is available on the upper right corner of the page. Clicking on it reloads the list of dashboards.
Workgroup
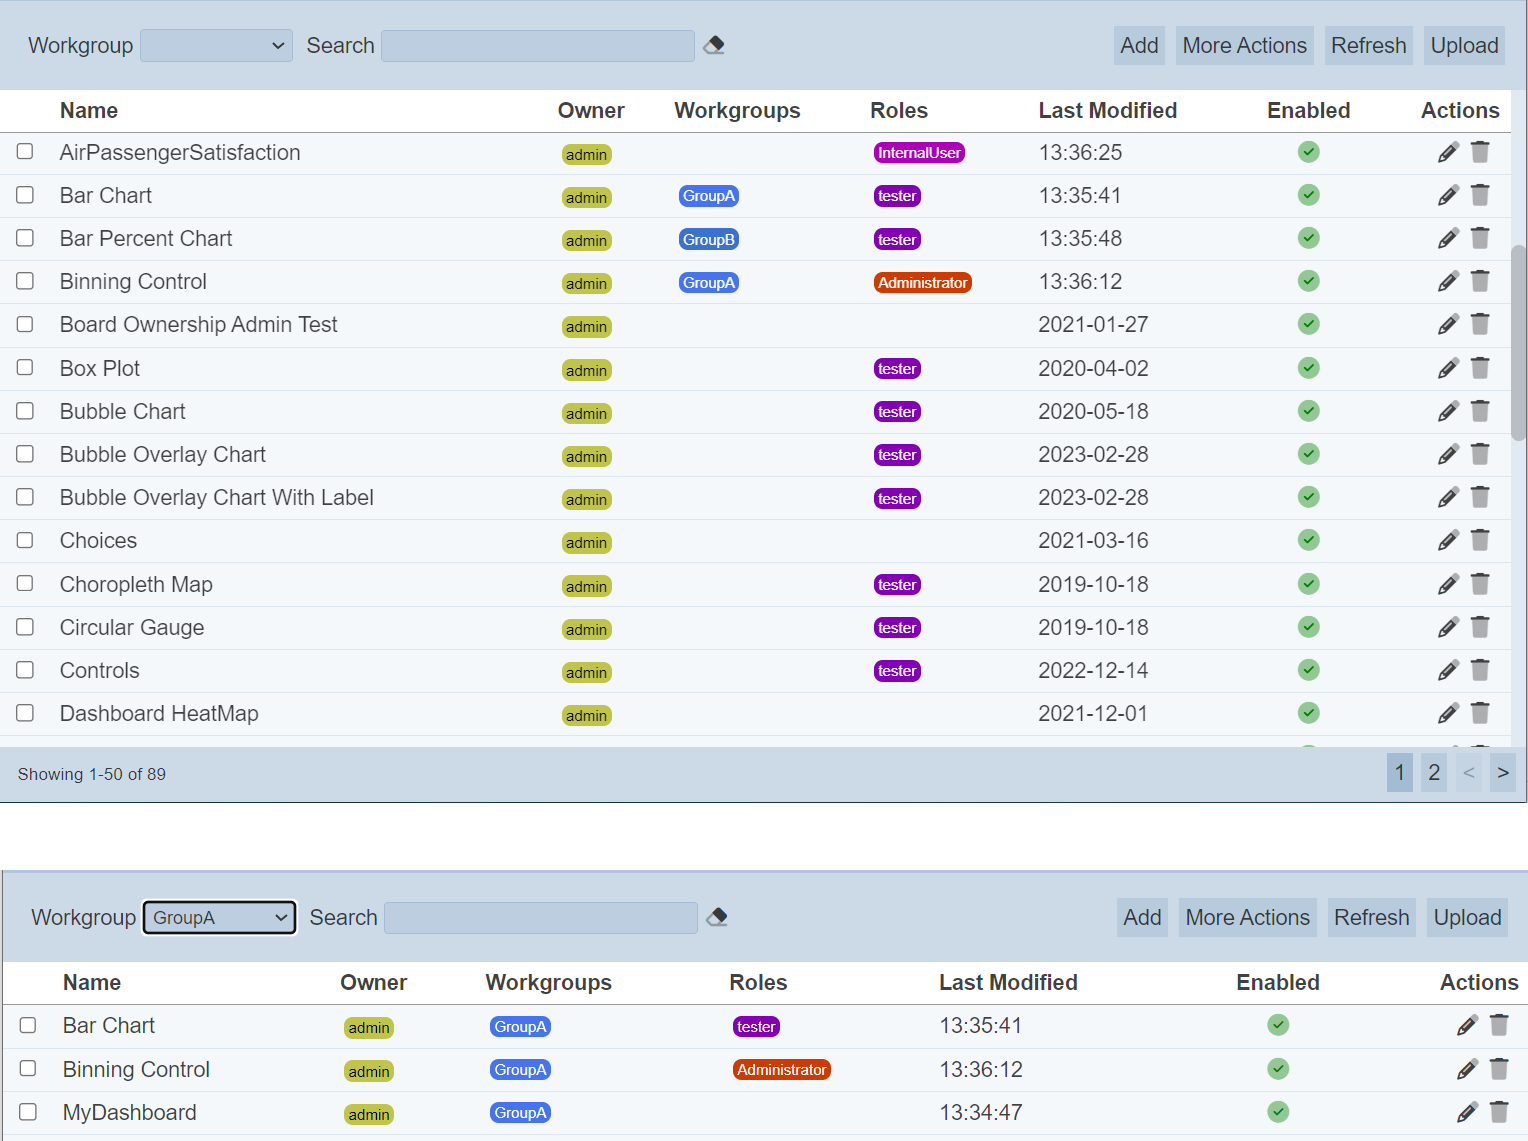
The “Workgroup” field at the top left corner of the page allows you to filter the dashboards associated with the selected workgroup.
Simply select the desired workgroup from the drop-down list and the dashboards associated with the selected workgroup will appear.
Do note that if no workgroup is created in the Workgroups module, the “Workgroup” field at the top left of the page will not appear.
Search
The search bar appears on the upper left corner of the page.

This provides an easy way to search through the dashboard list. It is case-insensitive and displays records that have the entered search value in any of the values of the fields below:
- Name
- Owner
- Workgroups
- Roles
- Last Modified
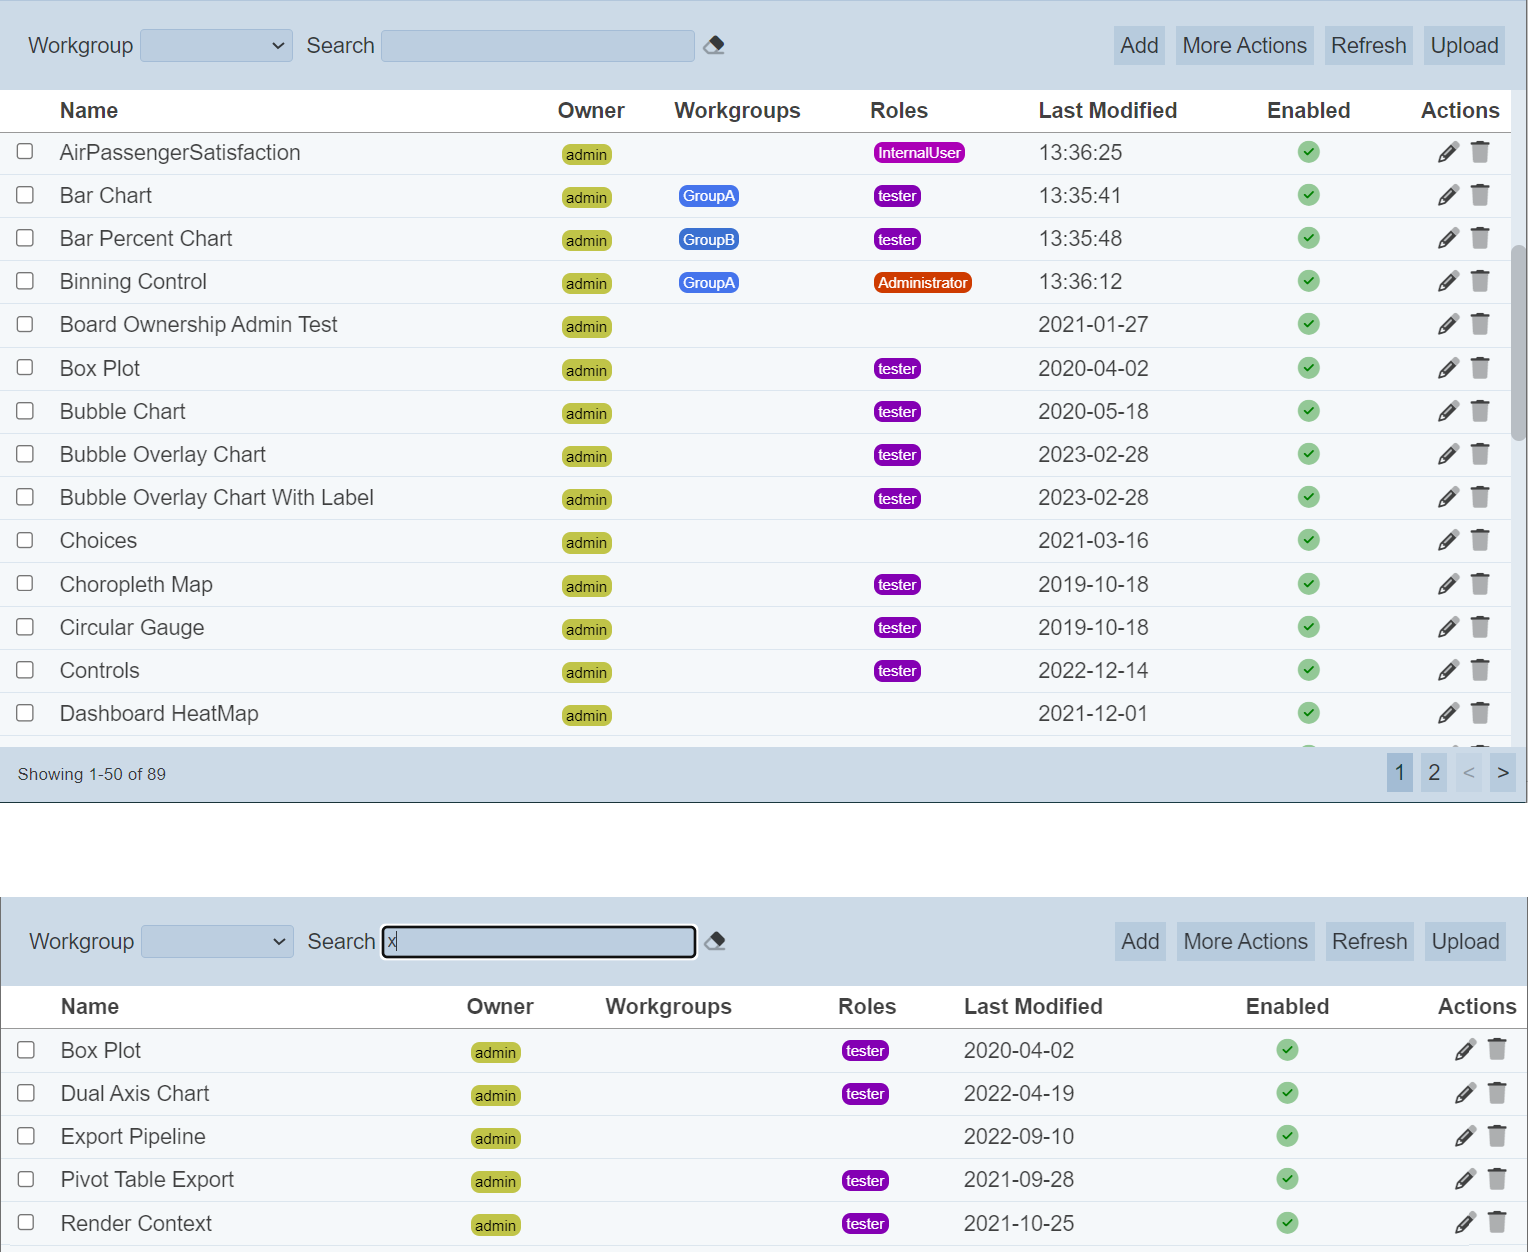
Alternatively, you can click on the any role, workgroup or owner under the “Roles”, “Workgroups” or “Owner” columns respectively to aid the search for the dashbaords in the page.
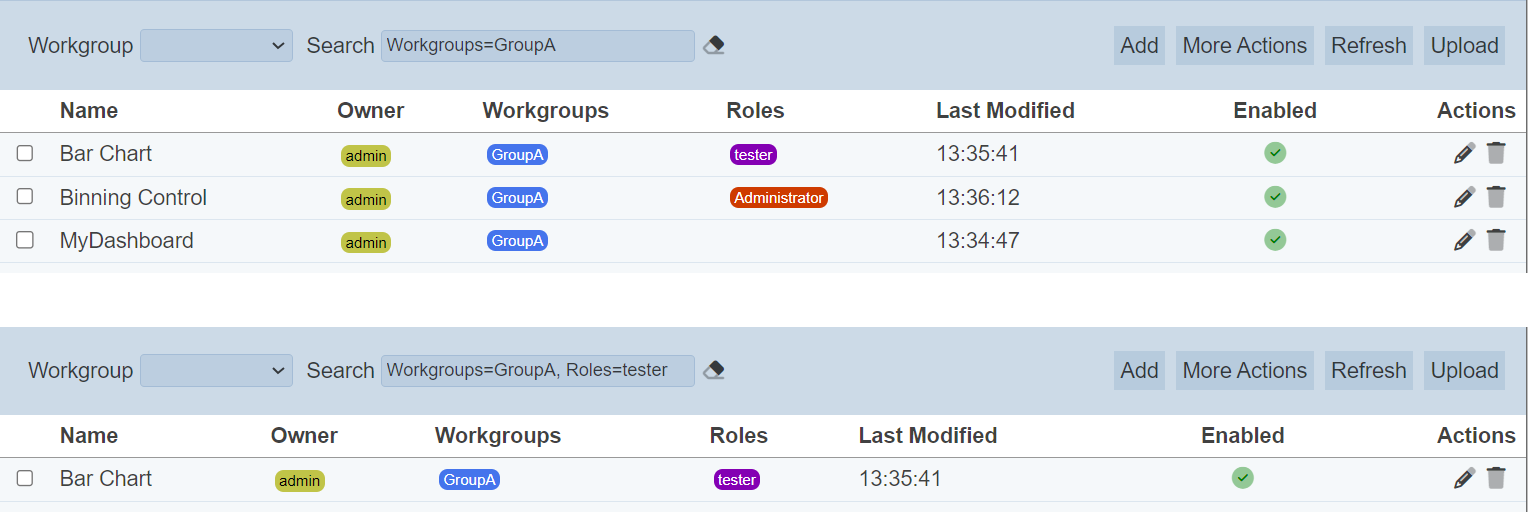
In the example above, dashboards that are assigned the workgroup “GroupA” and role “tester” are shown.
These two search methods can be combined together, with each criteria separated by a comma.