
Build Dashboard
The Dashboards module provides data visualization and interaction through various view types and configurations. The data presented on the dashboards are based on the available datasets set up in the Datasets module. To build a dashboard, the following steps are required:
-
Import data and create a dataset in Ambience (Imports module)
Or Create a dataset from the imported data (Datasets module)
-
Create a dashboard to display the dataset (Dashboards module)
The following sections describes the above steps.
Import Data and Create Dataset
Data is imported into Ambience via the Imports module. The Imports module can also create a dataset from the data imported. In the example below, it is assumed that there is only one database in MongoDB and the data to be imported is new. Use the following steps to import the new data into Ambience:
-
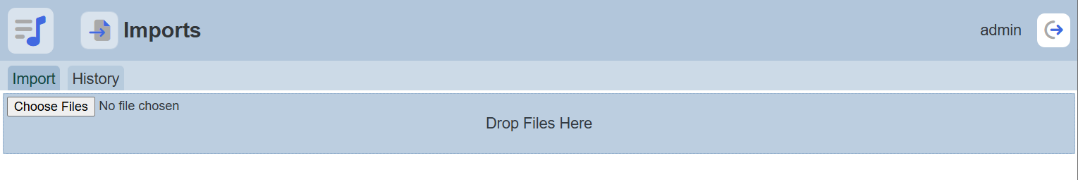
From the “Service Chooser” page, select “Imports” from the right panel. The “Imports” page will appear.
-
In the “Import” tab, browse to the location of the data file to be imported or simply drag-and-drop the data file onto the “Drop Files Here” portion.
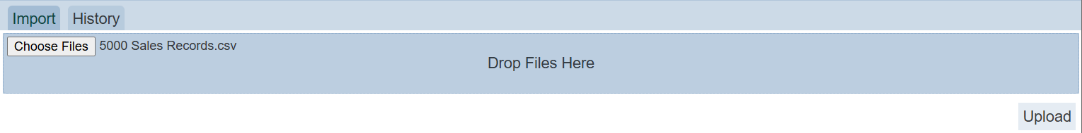
Upon detecting the file of supported types, the name of the file is displayed next to the “Browse” button and the “Upload” button will appear at the lower right below the “Drop Files Here” portion. An error message will appear if the selected file is not supported.
-
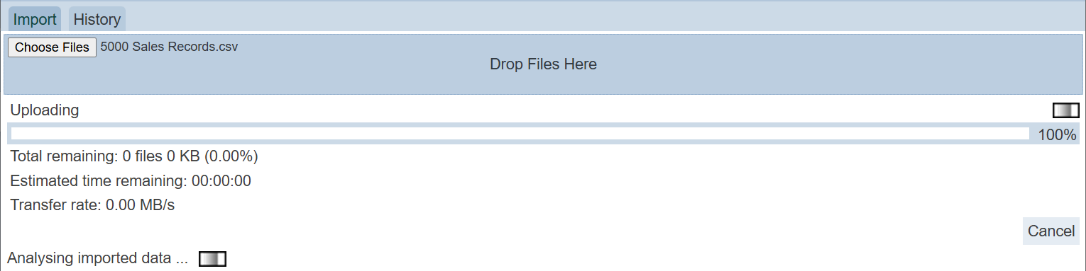
Click on the “Upload” button and the progress page will appear.
Do note that the progress page will appear during uploading and will disappear after data is uploaded. If the data file is too small, the progress page may not be visible. You can abort the uploading by clicking on the “Cancel” button at the bottom right of the page.
-
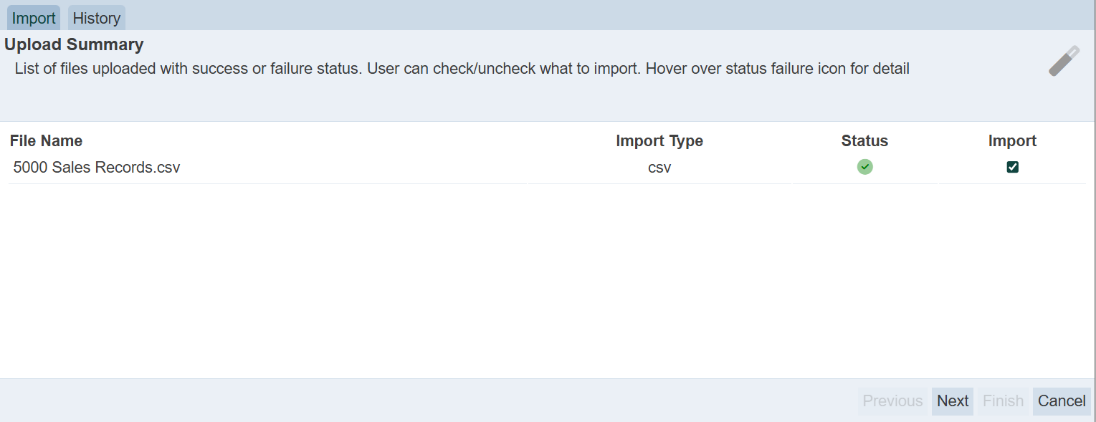
Upon successful uploading, the details of the data file are displayed. If a gzip file is selected, the list of files contained in the gzip will be displayed. You can select the desired file(s) to be imported. If no file is selected, only the “Finish” button will be selectable.
-
After selecting the desired file, click on the “Next” button to continue. The next page allows you to select the desired database and collection.
-
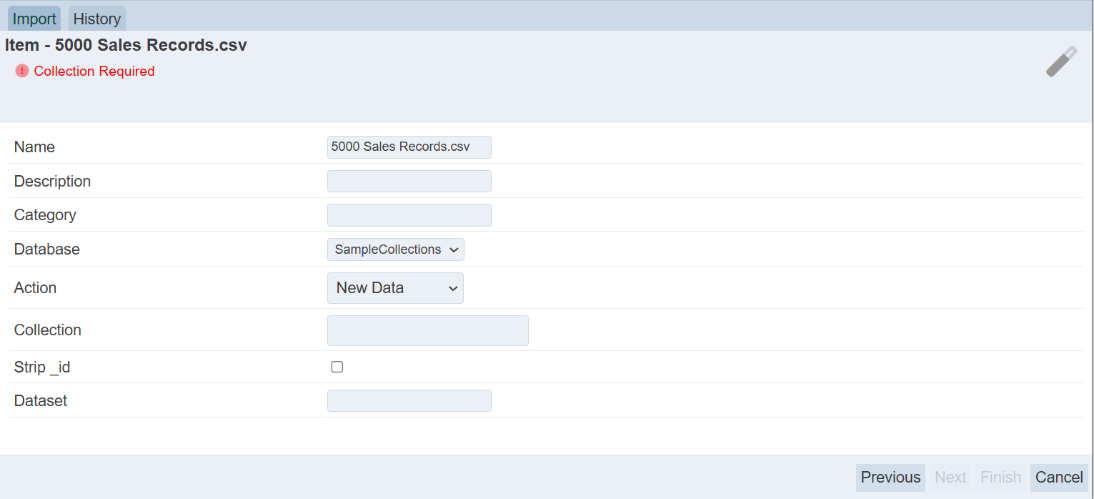
In the “Import” page, select and key in the following:
-
“Name” field – By default, the file name of the import file is used (if this is not desired, you can rename it)
-
“Description” field – Key in a brief description for the data (optional)
-
“Database” field – Ensure “eno” is selected
-
“Action” field – Selects the appropriate action type from drop-down list (in this example, select “New Data”)
-
“Collection” field – Key in the collection name for the data file
-
“Strip _id” field – Selects this field if _id field is not required in the dataset
-
“Dataset” field – Key in the dataset name of the data file (left this field blank if you do not wish to create a dataset)
-
-
After all the required data is filled, the “Next” button will appear. You can always click on the “Previous” button to go back to step 4.
-
If the imported data file is a CSV file, The “Import Item Schema” page will appear.
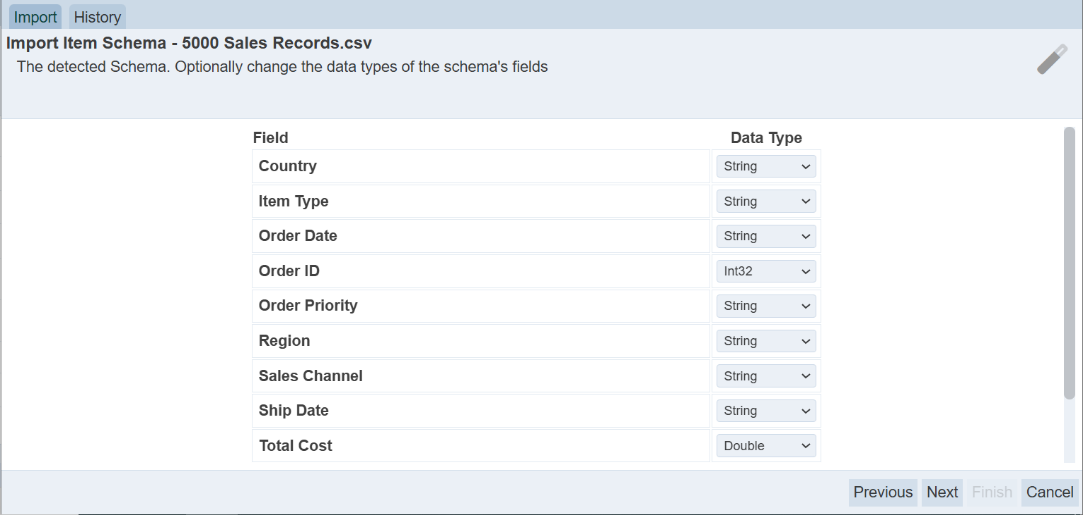
Select according and click on the “Next” button.
-
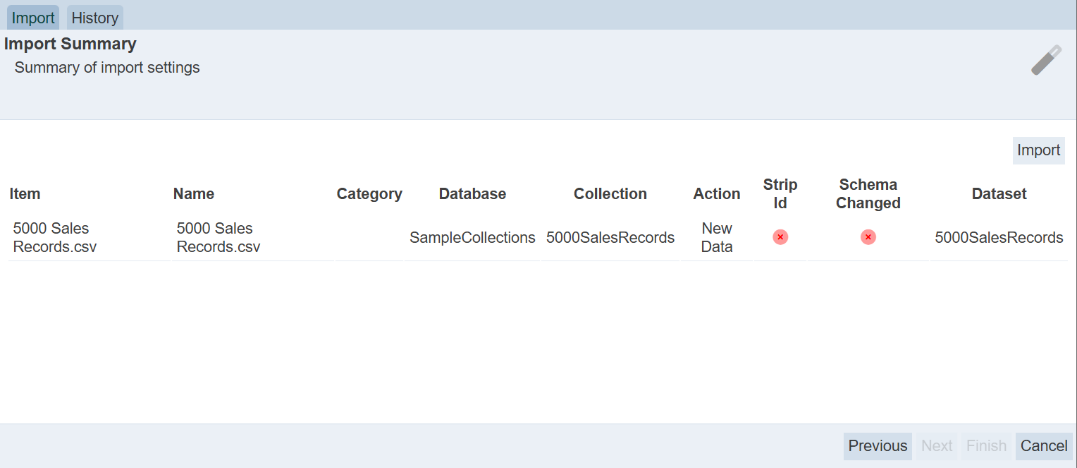
The “Import Summary” page will appear. Check through the information and click on the “Import” button on the upper right to import the data and create a dataset.
-
The “Import Results” page will appear, showing you the status of list of items selected for import.
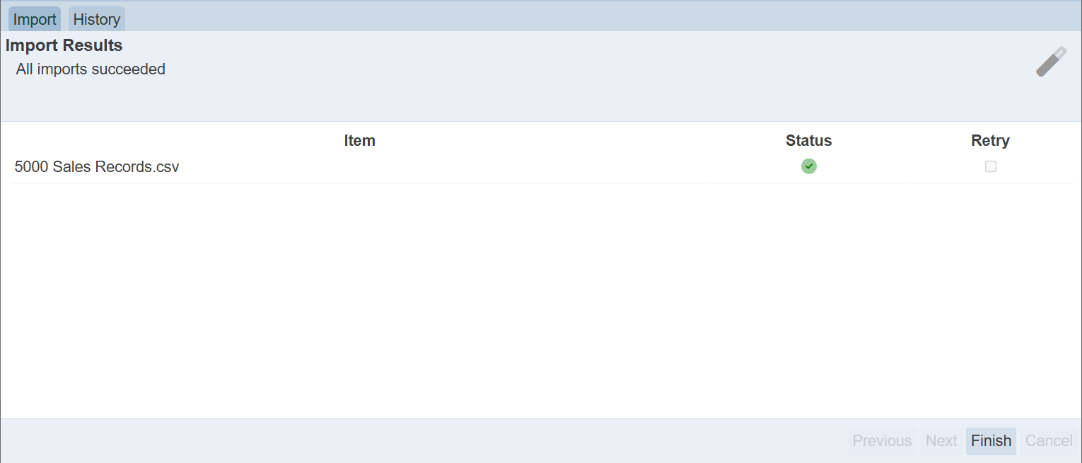
Any item that failed to import is indicated by a red cross under the “Status” column. You can try to import the item again by selecting the checkbox under the “Retry” column and click on the “Next” button that appears. If the item has a green tick under the “Status” column, it indicates that the import is successful. Click on the “Finish” button to complete the import and create the dataset.
-
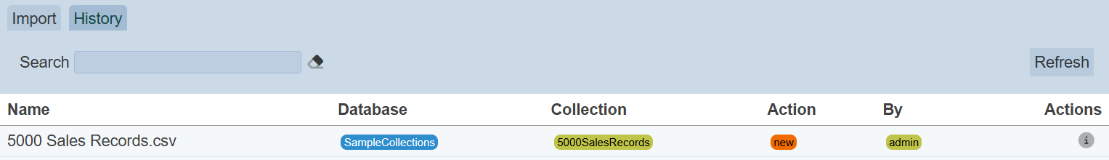
Click on the “History” tab and you will see the imported data.
Create Dataset
If the data imported has not been converted to a dataset in the Imports module, you can convert the data to a dataset using the Datasets module. Use the following steps to create a dataset:
-
Click on the
 “Elixir Ambience” logo and select the “All Services” option in the left panel, then select “Datasets” in the right panel.
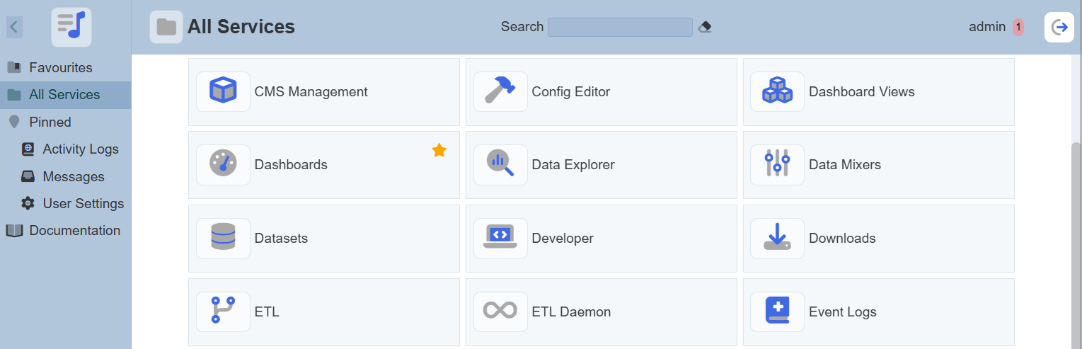
-
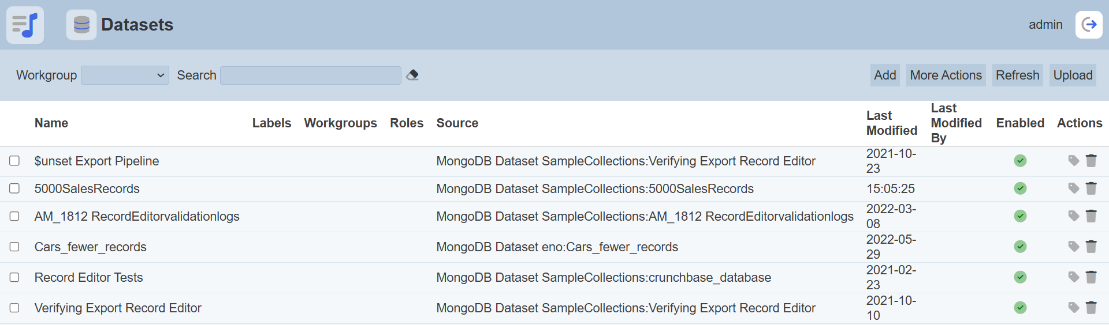
The “Datasets” page will appear.
-
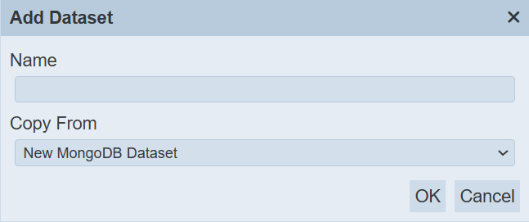
Click on the “Add” button at the upper right corner of the page and the “Add Dataset” dialog box will appear.
-
In the “Copy From” field, select “New MongoDB Dataset” and click on the “OK” button. The “Add” panel will appear.
-
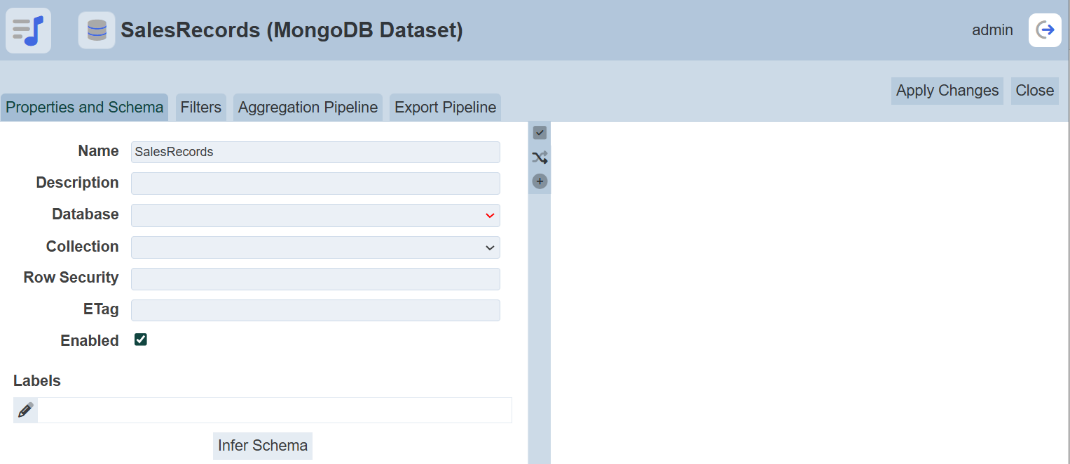
In the “Properties Schema” tab, key in and select the following:
-
“Name” field – Key in a name for the dataset
-
“Description” field – Key in a brief description of the dataset (optional)
-
“Database” field – Selects the appropriate database from the drop-down list
-
“Collection” field – Selects the desired data from the drop-down list
-
“Row Security” field – Key in the field to be used as access rights control for the dataset (optional)
-
“ETag” field – Key in an appropriate tag for the dataset (optional)
-
“Enabled” field – Ensure this field is selected
The “ETag” field is used to reflect when the dataset has changed by checking the last modified datatime.
-
-
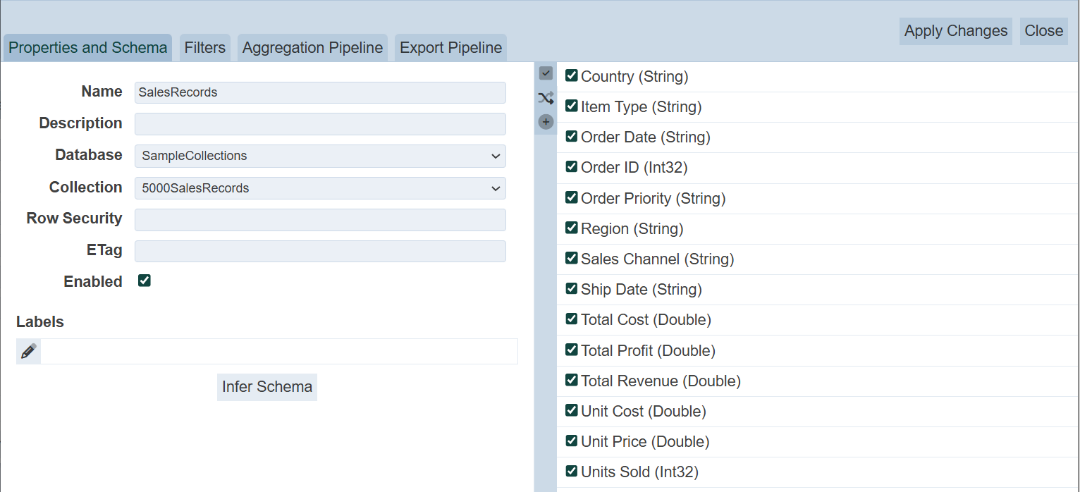
After all settings are done, click on the “Infer Schema” button.
-
From list of fields of the dataset displayed, you can choose to unselect any of the fields by un-selecting the checkbox.
-
Click on the “Apply Changes” button to save the dataset. A message will appear upon successful adding the dataset.

Click on the “Close” button to exit and return to the management page.
-
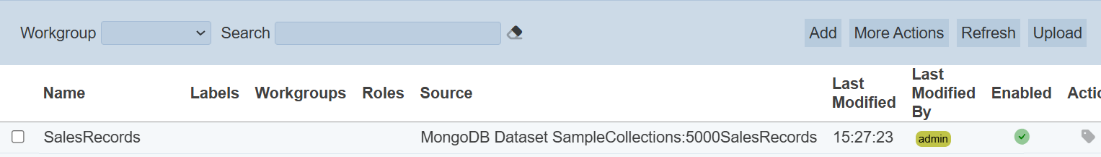
The dataset is now added into Ambience and can be used by other modules.
Create Dashboard
A dashboard provides data visualization and interaction through various view types and configurations. The data presented on the dashboards are based on the available datasets set up in the Datasets module. With the correct privileges, the following features are available in the Dashboards module:
-
View the list of dashboards
-
Add new dashboard (via Dashboard Designer)
-
Upload/download dashboard
-
Edit dashboard
-
Open dashboard (via Dashboard Viewer)
-
Delete dashboard
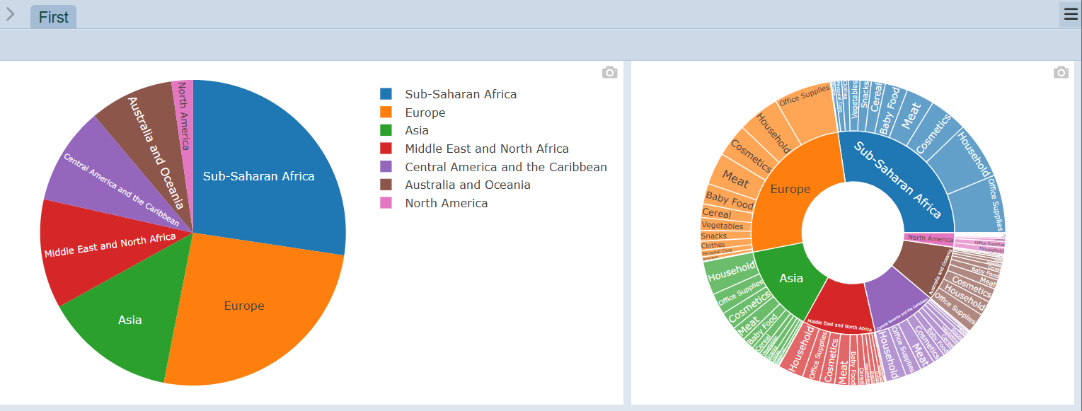
In the below sections, you will create a new dashboard, with two different charts (pie chart and sunburst chart) using the same dataset.
Create New Dashboard
Use the following steps to create a dashboard:
-
Click on the
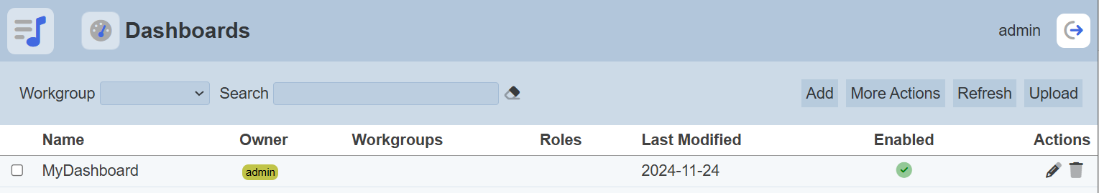
“Elixir Ambience” logo and select the “All Services” option in the left panel, then select “Dashboards” in the right panel. -
The “Dashboards” page will appear.
-
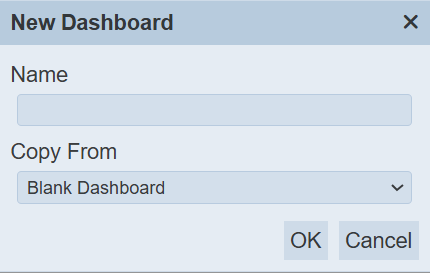
In the “Dashboards” page, click on the “Add” button on the upper right corner of the page. A “New Dashboard” dialog box will appear.
-
In the “New Dashboard” dialog box, key in and select the following:
-
“Name” field – Key in a name for the new dashboard
-
“Copy From” field – Selects to copy from existing dashboards from drop-down list or a blank dashboard (in this example, a blank dashboard is selected)
-
-
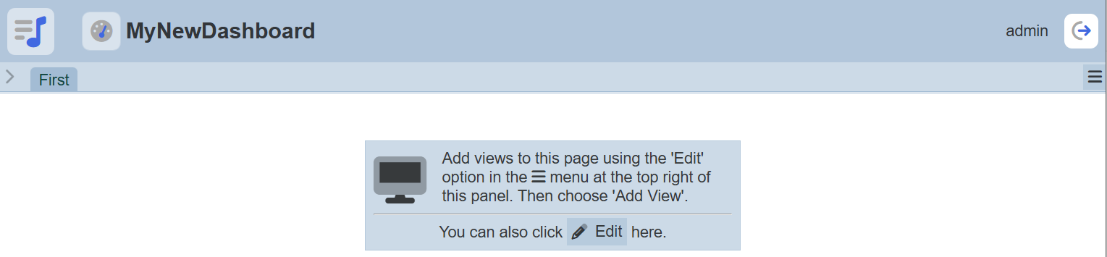
Click on the “OK” button to create the new blank dashboard. In this mode, you are in the Dashboard Designer page.
-
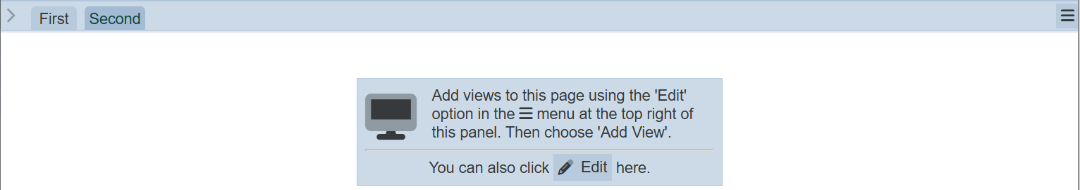
By default, the first page is labelled as “First”.
Create Pie Chart
In this section, you will create a pie chart.
-
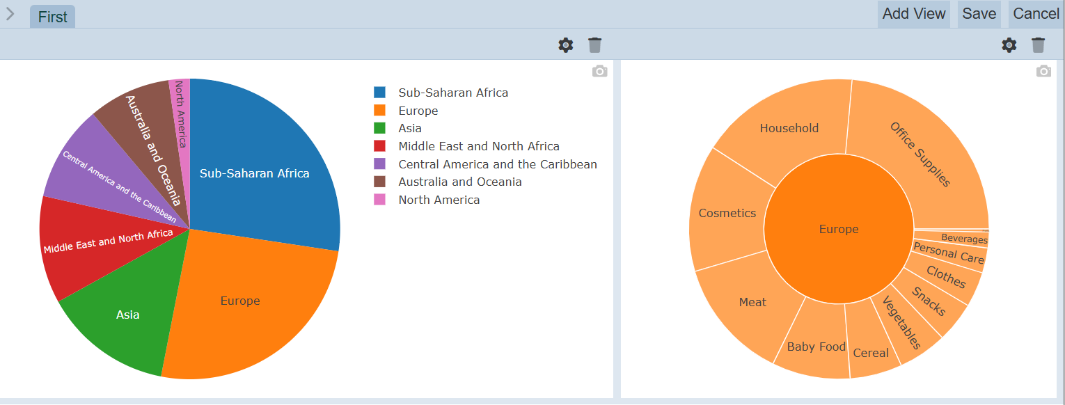
Click on the “Edit” button in the dialog box. The “Add View”, “Save” and “Cancel” buttons appears on the upper right corner of the page.

-
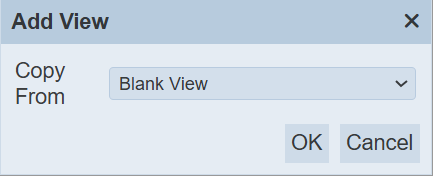
To add a view, click on the “Add View” button. The “Add View” dialog box appears.
-
In the dialog box, you can select a blank view or copy from existing views from the drop-down list. In this example, select a blank view.
-
Click on the “OK” button to create the view.
-
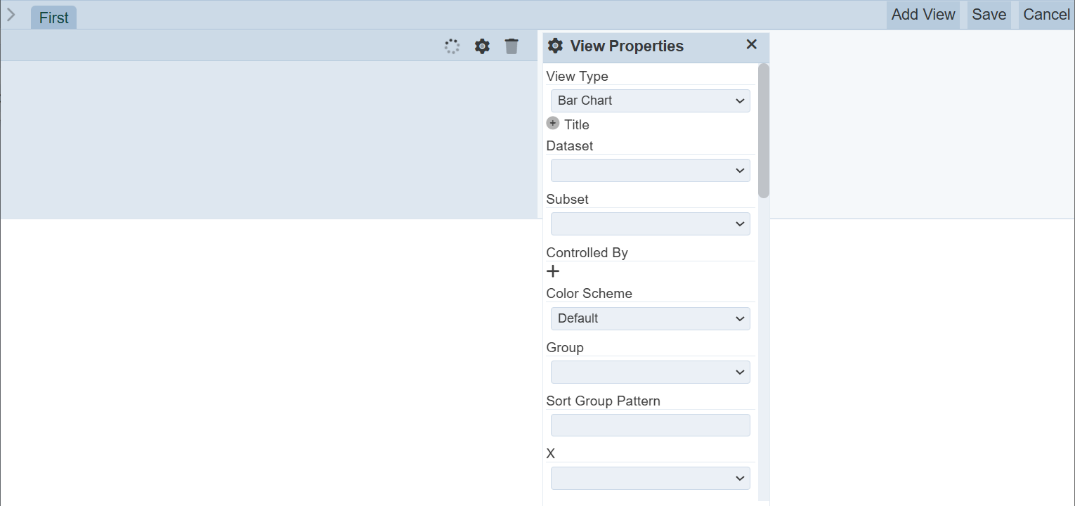
A blank area and the “View Properties” dialog box appears in the page. The fields in the “View Properties” dialog box will vary according to the different type of chart or view selected.
-
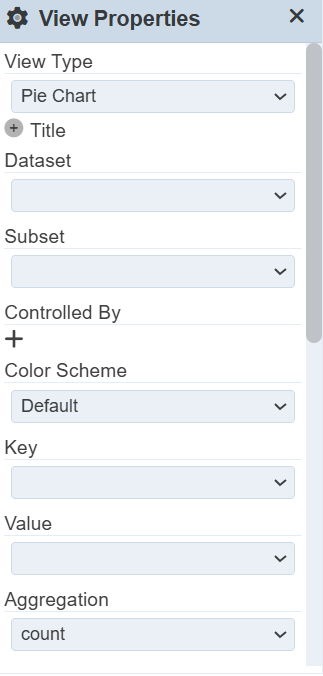
In the “View Type” field, select “Pie Chart” from the drop-down list and the other fields for pie chart will appear.
-
In the “View Properties” dialog box, select the following:
-
“Dataset” field – Selects the appropriate data set from drop-down list
-
“Key” field – Selects the appropriate field from drop-down list (this field groups output into separate groups based on the selected value)
-
“Value” field – Selects appropriate field from drop-down list as main output point (determines size of each portion based on selected “Aggregation”)
-
“Aggregation” field – Selects either “sum”, “average” and “count” from drop-down list (by default, “count” is selected) (this field is the accumulation of data by count, average or summation)
In this example, only the mandatory fields are used. The other optional fields are used to enhance or add features to the pie chart.
-
-
You can adjust the size of the view window by dragging the
 icon at the lower right corner of the view window when hover over the corner.
 -
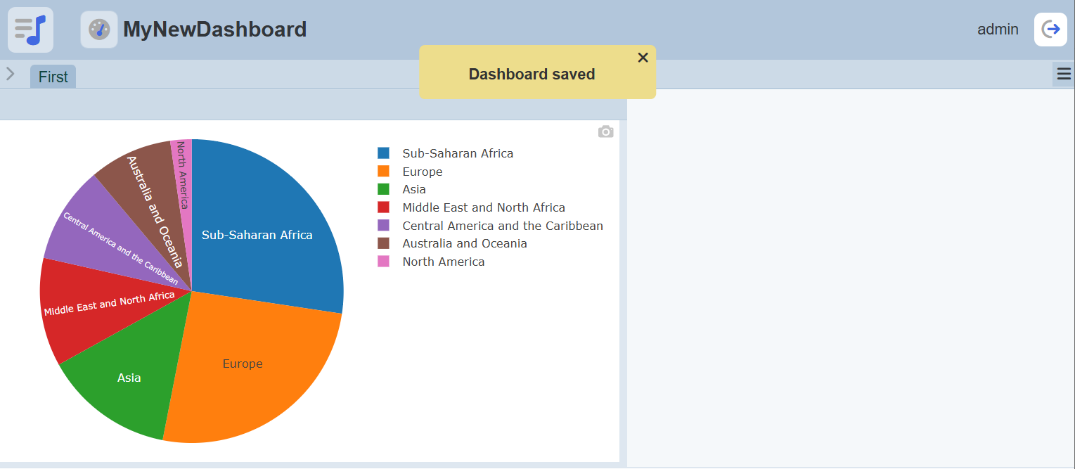
Click on the “Save” button to save the chart. A message will appear to inform you that the dashboard has been saved successfully.
Create Sunburst Chart
In this section, you will create a simple sunburst chart.
-
In the dashboard page, click on the
 “More Actions” icon at the upper right corner of the page to display a list of available actions.
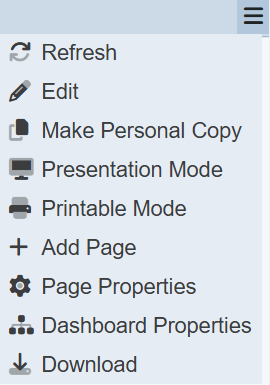
-
Select “Edit” and click on the “Add View” button on the upper right corner of the dashboard.
-
In the “Add View” dialog box that appears, select a blank view.
-
Click on the “OK” button to create the view.
-
A blank area and the “View Properties” dialog box appears in the page. By default, the new blank area is located below the first view. You can re-locate the view window and re-size the window.
-
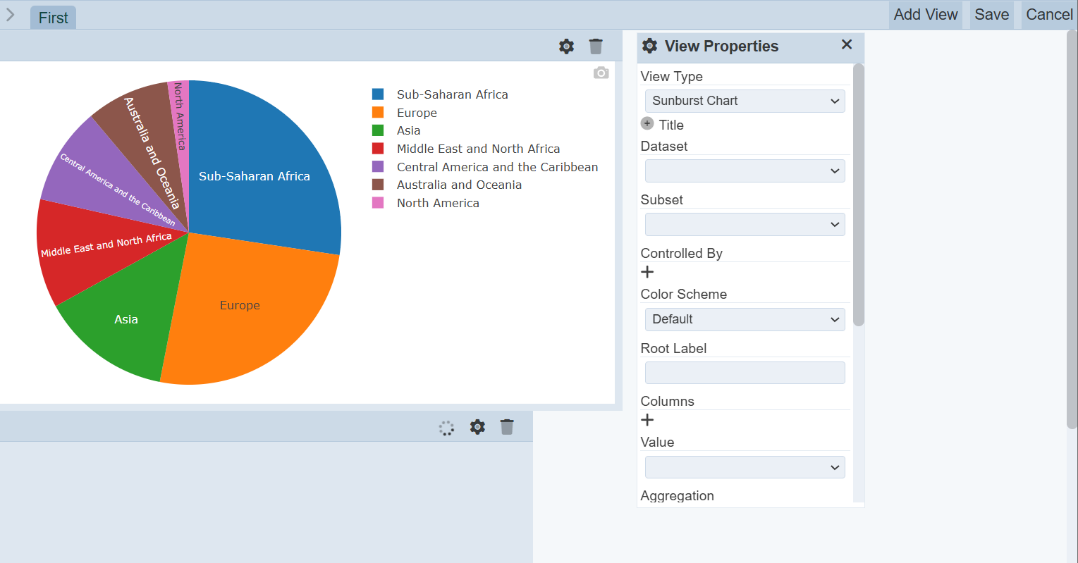
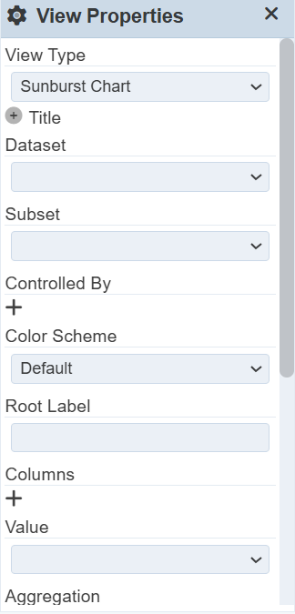
In the “View Type” field, select “Sunburst Chart” from the drop-down list and the other fields for sunburst chart will appear.
-
In the “View Properties” dialog box, select the following:
-
“Dataset” field – Selects the appropriate data set from drop-down list
-
“Columns” field – Selects the appropriate fields (see step 8)
-
“Value” field – Selects appropriate field from drop-down list as main output point (determines size of each portion based on selected “Aggregation”)
-
“Aggregation” field – Selects either “sum”, “average” and “count” from drop-down list (by default, “count” is selected) (this field is the accumulation of data by count, average or summation)
The sunburst chart uses the same dataset used in the pie chart and two nodes are selected. In this example, only the mandatory fields are used. The other optional fields are used to enhance or add features to the sunburst chart.
-
-
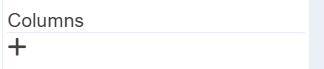
The “Columns” field defines the fields (nodes) to be displayed in the chart. The first column defined will be the innermost ring of the chart. The last column defined will be the outermost ring of the chart.
Use the following steps to add the two nodes:
a. Click on the “+” icon below the “Columns” field to add a node.
b. Select an appropriate field from the drop-down list.
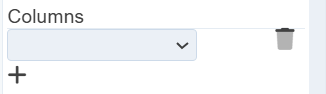c. Repeat steps a and b for another node.
d. You can re-order the nodes clicking on the
 “Move Up” and
  “Move Down” icons.
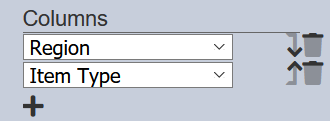 -
Click on the “Save” button to save the chart. A message will appear to inform you that the dashboard has been saved successfully.
-
In the sunburst chart, clicking on any portion in the inner ring and the chart will display the details of that portion.
In the below example, “Europe” is selected, the sunburst chart will display the details of Europe.
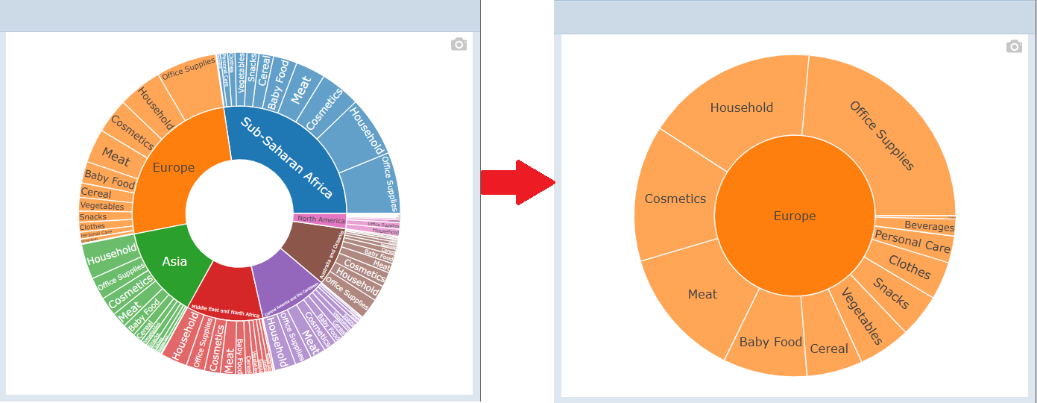
To return to the original chart, click on the “Europe” at the centre of the chart.
Edit Dashboard
You can edit the dashboard views using the Dashboard Designer. Use the following steps to edit a dashboard:
-
In the dashboard page, click on the
“More Actions” icon at the upper right corner of the page to display a list of available actions. -
In the list, select “Edit” to go to the Dashboard Designer (i.e., edit mode).
In the Dashboard Designer, the following functions are available:
-
Edit the existing view, table or chart
-
Delete the view, table or chart
-
Add a new view, table or chart
-
Add and/or edit control filters
-
Edit To edit the view, table or chart, click on the  “Properties” icon at the upper right corner of the pie chart window. The “View Properties” dialog box will appear. You can make the necessary changes and click on the “Save” button to save the changes. Delete To delete the view, table or chart, click on the
  “Delete” icon at the upper right corner of the pie chart window. Add View To add a new view, table or chart, click on the “Add View” button at the upper right corner of the page. A new blank area and the “View Properties” dialog box appears in the page. See Section 2.3.3 Create Dashboard onwards for how to create the new view. Control Filters See Section 2.4.1 Control Filters on how to create control filters.
Dashboard Pages
There are several operations that can be performed on the dashboard:
-
Add dashboard page
-
Switch between pages
-
Edit page properties
Add Dashboard Page
You can add pages to a dashboard. This will allow you to create more views or charts on the same dashboard. Use the following steps to add a dashboard page:
-
In the dashboard page, click on the “More Actions” icon on the upper right corner of the page to display a list of available actions.
-
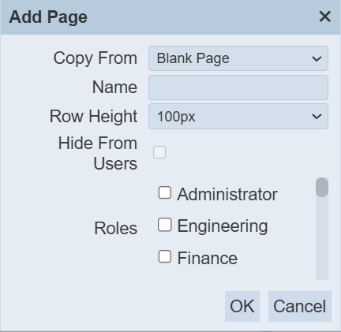
To add a new page, select and click on “Add Page”. The “Add Page” dialog box will appear.
-
In the “Add Page” dialog box, select and key in the following:
-
“Copy From” field – Selects to copy from existing page or create a blank page (in this example, select “Blank Page”)
-
“Name” field – Key in a unique name for the new page
-
“Row Height” field – Height of the page (default is 100 px)
-
“Roles” field – Selects the appropriate roles
-
-
Click on the “OK” button to save the changes. A new page will be added to the dashboard.
Switch Between Pages
To switch between pages, click on the name of the page, that is, “First” and “Second”.
Edit Dashboard Page
Use the following steps to edit the dashboard page:
-
Select the desired page.
-
Click on the
“More Actions” icon on the upper right corner of the page and select “Page Properties”. The “Edit Page Properties” dialog box will appear.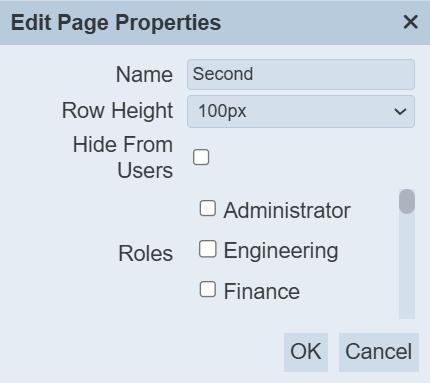
-
In the “Edit Page Properties” dialog box, make the necessary changes.
-
Click on the “OK” button to save the changes.