
Build Dynamic Dashboard
Control Filters
Control filters provides a highly customizable ways of controlling the data to be displayed on the dashboard views. Managing and configuring a dashboard’s controls are done through the Dashboard Designer. A control can be linked to multiple views across all pages on the dashboard and a view can also be linked with multiple controls. Controls become usable, typically as interactive filters for users, through the Dashboard Viewer. Controls can be categorized into several types:
| Control Type | Description |
|---|---|
| Filter control | Apply filters on a specific field of the dataset displayed on a view |
| Inject control | Advanced features for passing data (e.g., filter values as input parameters values) to other modules, such as ETL. |
| Parameter control | Allows parameterisation of aggregation pipeline |
| Timer control | Provides an easy way to add real-time or near real-time data updates on the dashboard |
Checkbox Filter Control
Below is an example on how to create a checkbox filter control for the pie chart that was created earlier. Use the following steps to create a checkbox filter control:
-
In the dashboard page, click on the
 “More Actions” icon on the upper right corner of the page and select “Edit”. The dashboard is now in the Dashboard Designer mode.
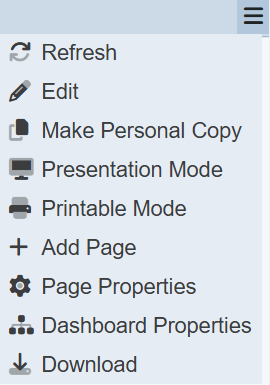
-
On the upper left corner of the page, click on the
 “Open Filter Panel” icon.
-
This will open the Filter Panel.
-
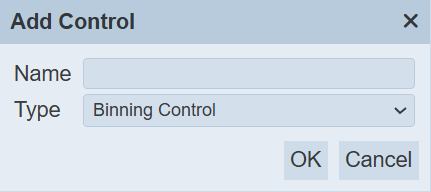
In the Filter Panel, click on the “+” icon to create a new control. The “Add Control” dialog box will appear.
-
In the “Add Control”: dialog box, key in and select the following:
-
“Name” field – Key in a name for the control
-
“Type” field – Selects “Checkbox Filter” from the drop-down list
-
-
Click on the “OK” button to save the settings and the “Add Control” dialog box will close.
-
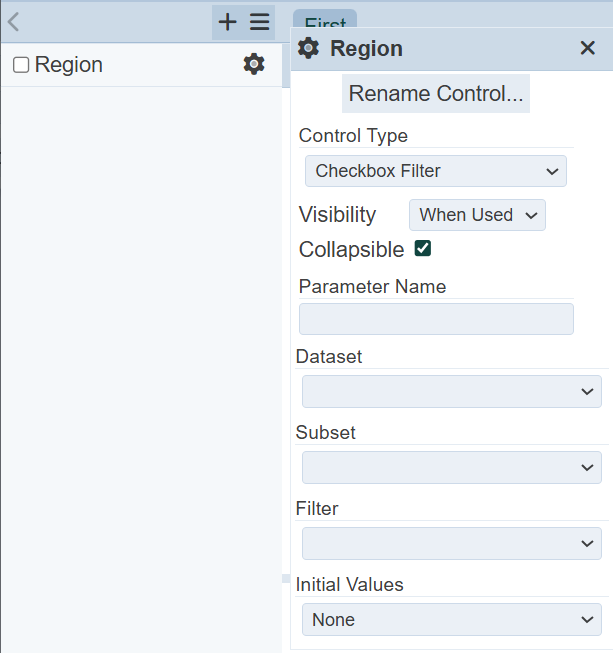
The new filter is added onto the Filter Panel and the dialog box for the new filter appears.
-
Select the following:
-
“Visibility” field – Selects “Always” to show filter in the filter panel at all time
-
“Dataset” field – Selects the same dataset as for the pie chart
-
“Filter” field – Selects a field from the drop-down list as the filter value
-
-
Click on the
 “Properties” icon on the pie chart window to display the “View Properties” dialog box.
 -
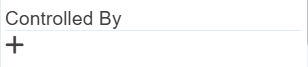
In the “View Properties” dialog box, click on the “+” icon below the “Controlled By” field. Select the newly added filter control.
-
Click on the “Save” button on the upper right corner of the page to save the changes and goes back to the Dashboard Viewer.
-
In the dashboard, click on the
 “Expand” icon to display the values. Select the desired values and see the effect of the filter control by comparing the below chart with the chart in step 3.
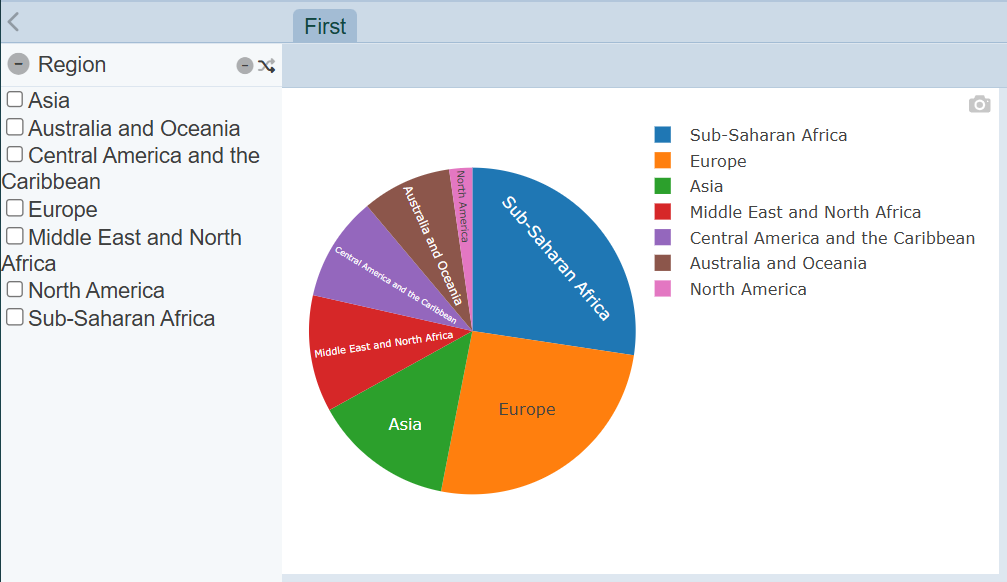
-
To quickly reverse the selection, click on the
 “Invert Selection” icon in the Filter Panel or remove all selection by clicking on the
  “Deselect All” icon.
 -
To close the Filter Panel, click on the
“Collapse” icon on the left. Do note that by doing so, the selection in the control filter will not take effect.
Interval Timer Control
Timer control provides an easy way to add real-time or near real-time data updates on the dashboard. This timer control is used to created fixed-interval data refreshing on the dashboard, specifically by reloading the datasets displayed on views it controls. Use the following steps to create a timer control:
-
In the dashboard page, click on the
“More Actions” icon on the upper right corner of the page and select “Edit”. The dashboard is now in the Dashboard Designer mode. -
On the upper left corner of the page, click on the
icon. -
This will open the Filter Panel.
-
In the Filter Panel, click on the “+” icon to create a new control. The “Add Control” dialog box will appear.
-
In the “Add Control”: dialog box, key in and select the following:
-
“Name” field – Key in a name for the control
-
“Type” field – Selects “Interval timer” from the drop-down list
-
-
Click on the “OK” button to save the settings and the “Add Control” dialog box will close.
-
The new filter is added onto the Filter Panel and the dialog box for the new filter appears.
-
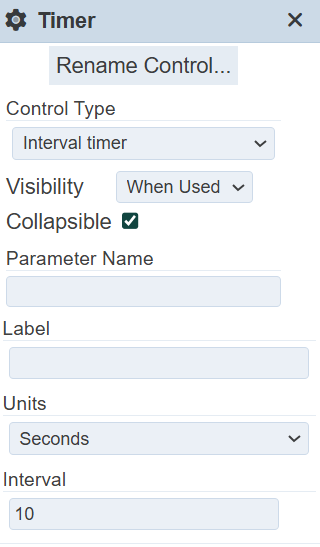
In the dialog box, key in and select the following:
-
“Control Type” field – Selects “Interval timer” from drop-down list
-
“Units” field – Selects the desired time unit from drop-down list
-
“Interval” field – Key in the desired interval in the text box or alternatively increase or decrease the value by clicking on the “Increase” or “Decrease” icons
-
-
For any dashboard that requires regular refresh, select this timer control in the “Controlled By” field in the “View Properties”.
Interactivity
There are several ways to interact between views and dashboard pages. Below are two methods:
-
Select to Control
-
Click to Page
Select to Control
The “Select to Control” feature allows you to use the current view or chart to control the content of a view or chart. Do note that both views or charts must use the same dataset. Use the following steps to create a “Select to Control” feature:
-
In the Dashboards page and select the desired dashboard.
-
Ensure there are at least two views or charts in the dashboard.
-
In the dashboard page, click on the
“More Actions” icon and select “Edit”. -
Create a filter control:
a. Click on the
icon on the upper left corner of the page to display the Filter Panel.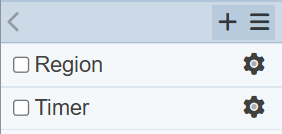
b. Click on the “+” icon in the Filter Panel. The “Add Control” dialog box will appear.
c. In the dialog box, key in and select the following:
- "Name" field -- A unique name for the control

- "Type" field -- Selects "Select Filter" from the drop-down list
d. Click on “OK” button to create the new filter. The “Control” dialog box will appear.
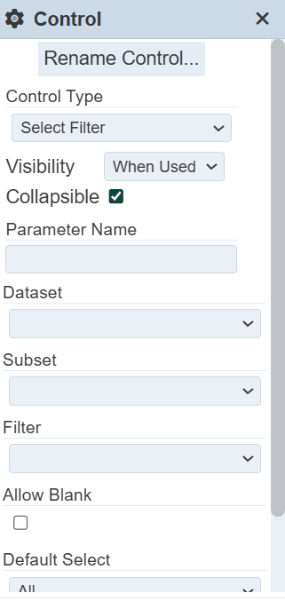
e. In the “Control” dialog box, select the following:
- "Control Type" field -- Selects "Select Filter" from drop-down list - "Visibility" field -- Selects "Hidden" from drop-down list - "Dataset" field -- Selects the same dataset as the two charts created earlier from the drop-down list - "Filter" field -- Selects the same field selected as "Key" in the two charts from drop-down list By selecting "Hidden" for "Visibility" field, this filter will only be shown in the Dashboard Designer mode (or Edit mode). In Dashboard View mode, this filter will not be displayed in the Filter Panel, thus user will not be able make selection on this filter. In this example, it is recommended to keep this filter hidden. -
In the first view (pie chart), perform the following:
a. Click on the
“Properties” icon to display the “View Properties” dialog box.b. In the dialog box, scroll to the “Select to Control” field.
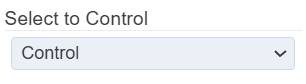
c. Select the newly created filter control from the drop-down list.
-
In the second view (sunburst chart), perform the following:
a. Click on the
 “Properties” icon to display the “View Properties” dialog box.
b. In the dialog box, scroll to the “Controlled By” field.
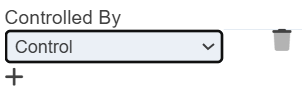
c. Click on the “+” icon to add a new selection.
d. Select the newly created filter control from the drop-down list.
-
Click on the “Save” button on the upper right corner of the page to save the changes.
-
Close the Filter Panel if it is not closed.
-
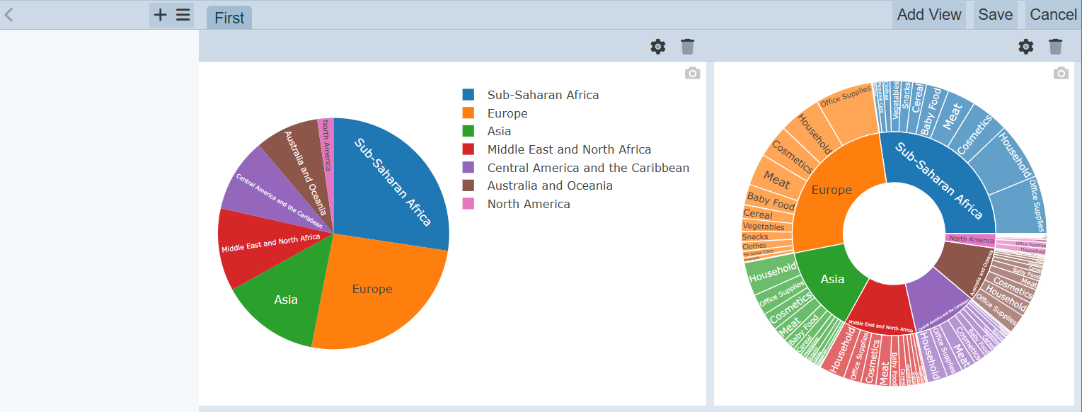
Click on any portion of the pie chart, the contents in the sunburst chart changes accordingly.
In the below example, “Europe” is selected in the pie chart. The sunburst chart changes to display the contents for Europe only. To revert back to the original view, click in the
 “Reset” icon on the title of the pie chart.
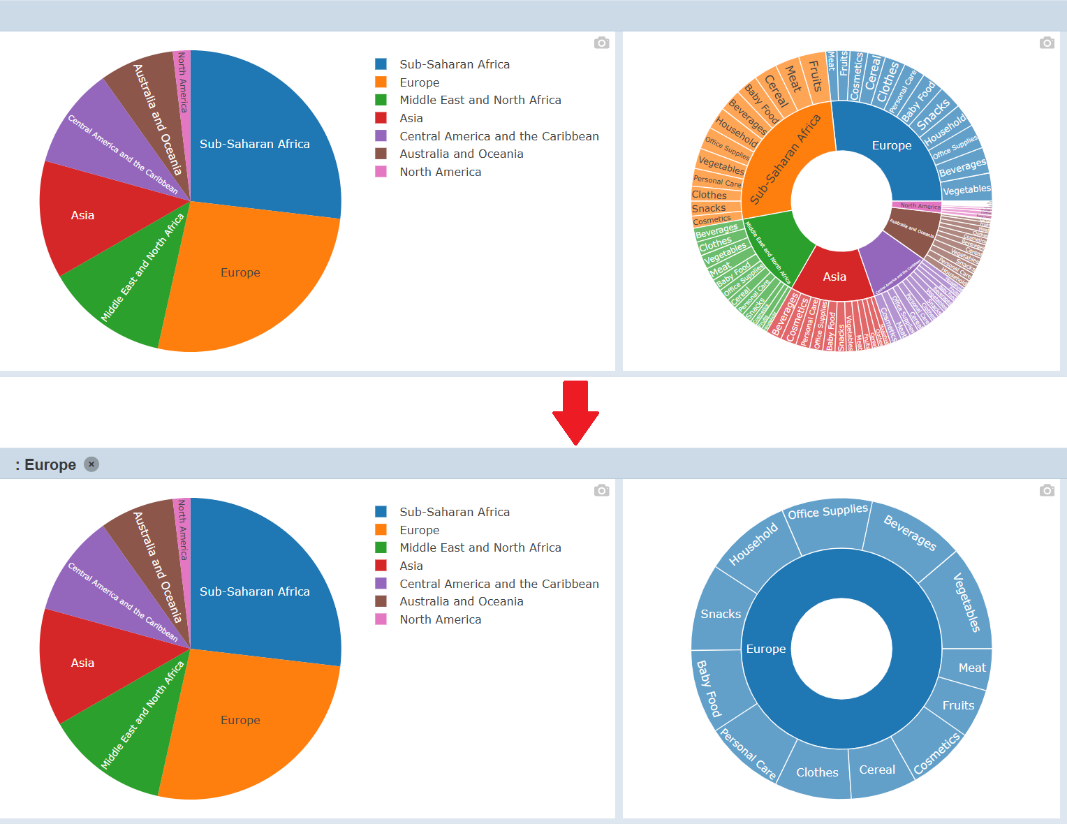
Click to Page
The “Click to Page” feature allows you to switch to another dashboard page with a single click on the view. Use the following steps to create a “Click to Page” feature:
-
In the “Dashboards” page and select the desired dashboard.
-
Ensure there are at least two pages in the dashboard.
-
In the dashboard, click on the
“More Actions” icon and select “Edit”. -
Click on the
“Properties” icon in the view window to display the “View Properties” dialog box. -
In the dialog box, scroll to “Click to Page” field.
-
Select the desired page to from the drop-down list.
-
Click on the “Save” button to save the change.
-
To see the effect, click anywhere in the dashboard page and it will bring you to the selected page.
Do note that there are some weightings on some of the features. Some properties have priorities over others. You may have noticed that once the “Click to Page” feature is implemented, the “Select to Control” feature is ineffective. Thus, these two features should not be used together.