
Stacked Bar Filter
Description
This filter control is commonly used to filter datasets based on two specific fields identified in the Filter properties. This filter has a two-tier structure. Both are fields of the same dataset but are not related to each other (i.e. selecting one value does not affect the available options of the other). Only one value at a time can be set for each of the two fields.
This is suitable for string-type fields (field identified for Filter). This can be used as a simple filter on most views but is more useful as a hidden control used with the bar chart’s Select to Control property, which enables more interaction between views (i.e. selecting a bar on a stacked bar chart controls the displayed records on a Linear Table on the same page).
Viewer Usage
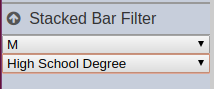
There are two tiers on the filter: - first tier - second tier
The data displayed are actually filtered by the two field values.
To use as a simple filter, simply set either or both field values.
Control Mechanism Usage
To use as a mechanism that allows a selecting a bar on a bar chart to control the data displayed on another view, both views must have relatable datasets. This means that both datasets used on both views must at least have the same two fields and data types.
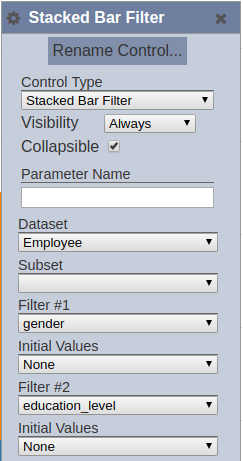
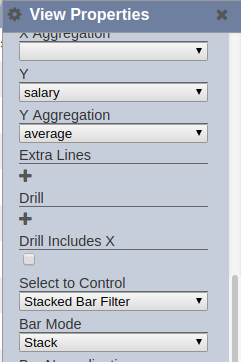
Set the Stacked Bar Filter control by selecting the bar chart’s Group By field as “Field #1”. Set the bar chart’s X field as “Field #2”.
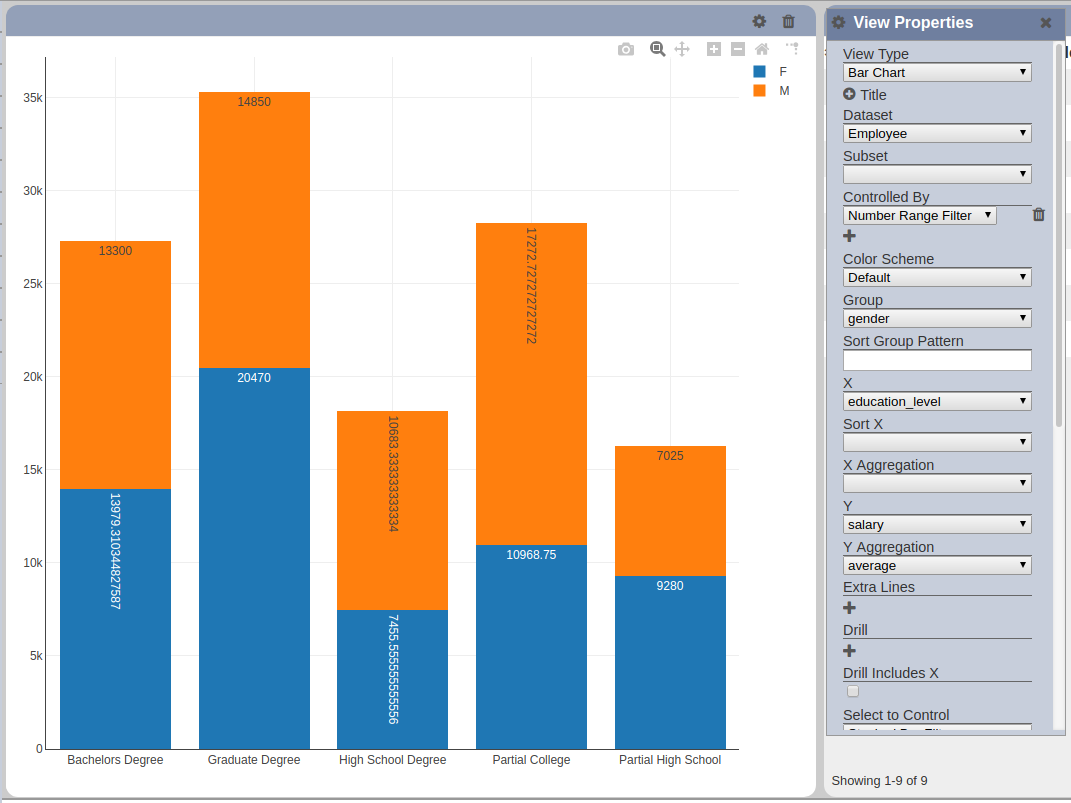
Add the created Stacked Bar Filter control to the bar chart view’s Select to Control property. Sample of the bar chart’s set properties is shown below.
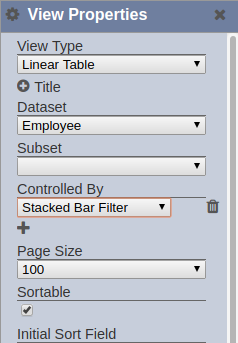
In this example, the selection on the bar chart view controls the displayed records on a Linear Table view. If exactly the same dataset is used on both bar chart and Linear Table views, the latter would effectively display all records that are aggregated into the selected bar. Add the new control to the Linear Table’s Controlled By property.
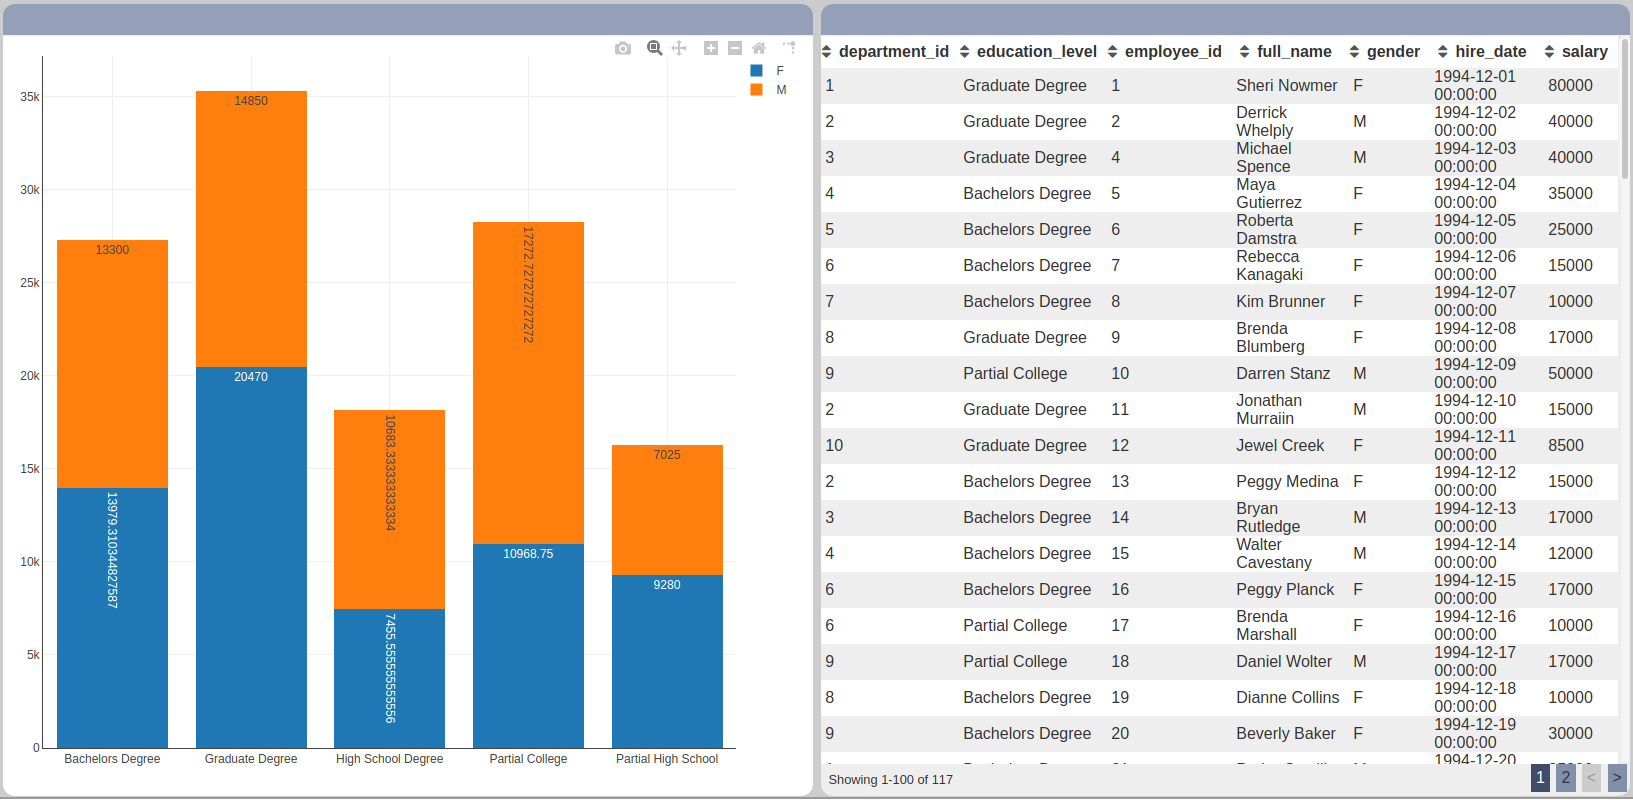
Once saved, click on any bar on the bar chart view. The displayed records on the Linear Table displays only the records for the selected bar.
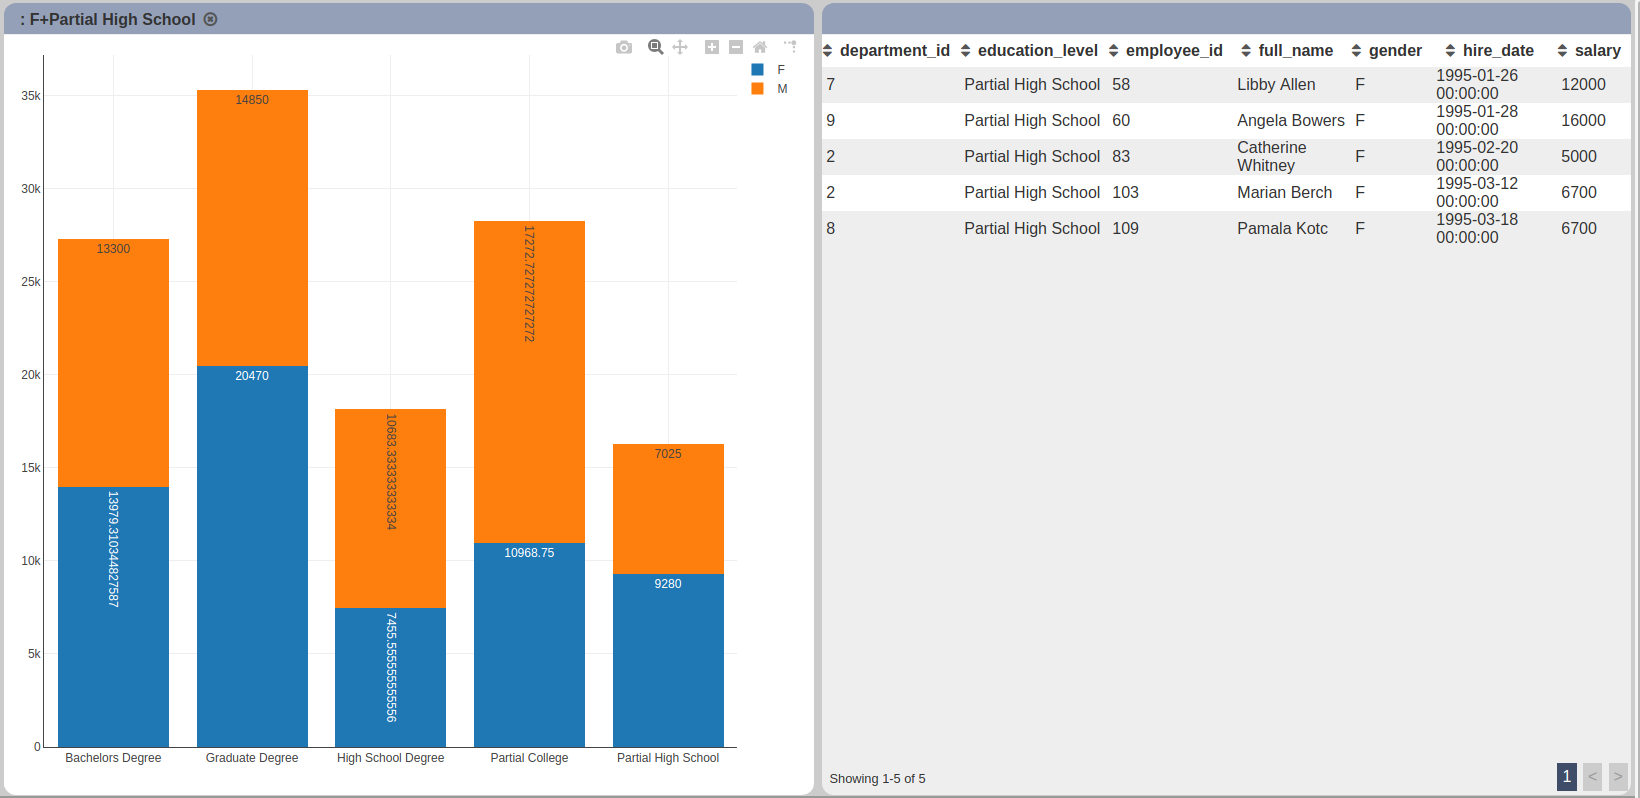
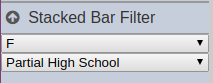
The bar for gender “F” and education_level “Partial High School” has been selected. This is also reflected on the bar chart view’s title as shown above. It appends the title given to the view, if any.
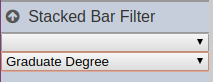
If the Stacked Bar Filter control is displayed on the control panel, the fields also reflect the selected bar’s values.
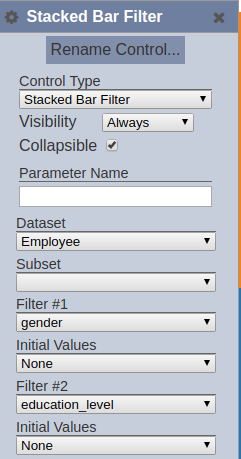
Specific Properties
Below are the fields that are specific to this control:
| Field | Description | Mandatory | Input Type | Constraints | Default Value |
|---|---|---|---|---|---|
| Group | Dataset field used to group the values of the field selected in the “Filter” property. | Y | Select | 1 value can be selected. All fields of the selected dataset/subset combination. The dataset and subset (optional) must be selected first. | “None” |
| Initial Values (first) | Determines the initial set or selected values upon loading in the Dashboard Viewer. This corresponds to the field selected for the “Filter #1” property. | Y | Select | 1 value can be selected. Available options are: - None (all options are deselected) - First (only the first displayed option is selected) - Last (only the last displayed option is selected) - All (all of the options are selected) - Values (first element of comma-separated values entered in the field that appears below this property; spaces are allowed before and after the comma)  |
“None” |
| Initial Values (second) | Determines the initial set or selected values upon loading in the Dashboard Viewer. This corresponds to the field selected for the “Filter #2” property. | Y | Select | 1 value can be selected. Available options are: - None (all options are deselected) - First (only the first displayed option is selected) - Last (only the last displayed option is selected) - All (all of the options are selected) - Values (first element of comma-separated values entered in the field that appears below this property; spaces are allowed before and after the comma) |
“None” |