GIS View
The GIS view allows you to load a subset of the GIS Explorer features into a view to display geographic data as well as perform some basic GIS functions.
The following is a list of the fields in the View Properties box in the dashboard designer for GIS view. There are some required fields to be set for each created view.
Basic Properties
The View Properties fields vary in different charts. Below are the basic properties in the View Properties box.
| Field | Description | Mandatory |
|---|---|---|
| View Type | Type of chart, table or view. | Yes |
| Title | Name of the view. | No |
| GIS Explorer | Data used for the the GIS view. | Yes |
The dataset and subset data derive from Dataset Management. Choose the right chart from the View Type and data points to build a view. Also, be consistent in using the color scheme and formatting.
Other Properties
The other property fields are available to enhance the view. Below are the other properties in the View Properties box for the GIS view.
| Field | Description | Default |
|---|---|---|
| Show External Link | If selected, display an external ink icon in the view. | Selected |
| Selection Field | Determines the field to be used for selection that related with other dashboard or view. To be used with conjunction with “Select to Control” property. |
Empty |
| Controlled By | Links dashboard controls to the view. One or more controls can be added to affect the data displayed on the view. |
Empty |
| Select to Control | Allows a selection made in the view to set the value of a control. Other views which are dependent on that control will then update accordingly. | Empty |
| Maximisable | If selected, places a maximise button on the top right of the view (when not in edit mode). This will maximise the view to fill the browser. |
Not selected |
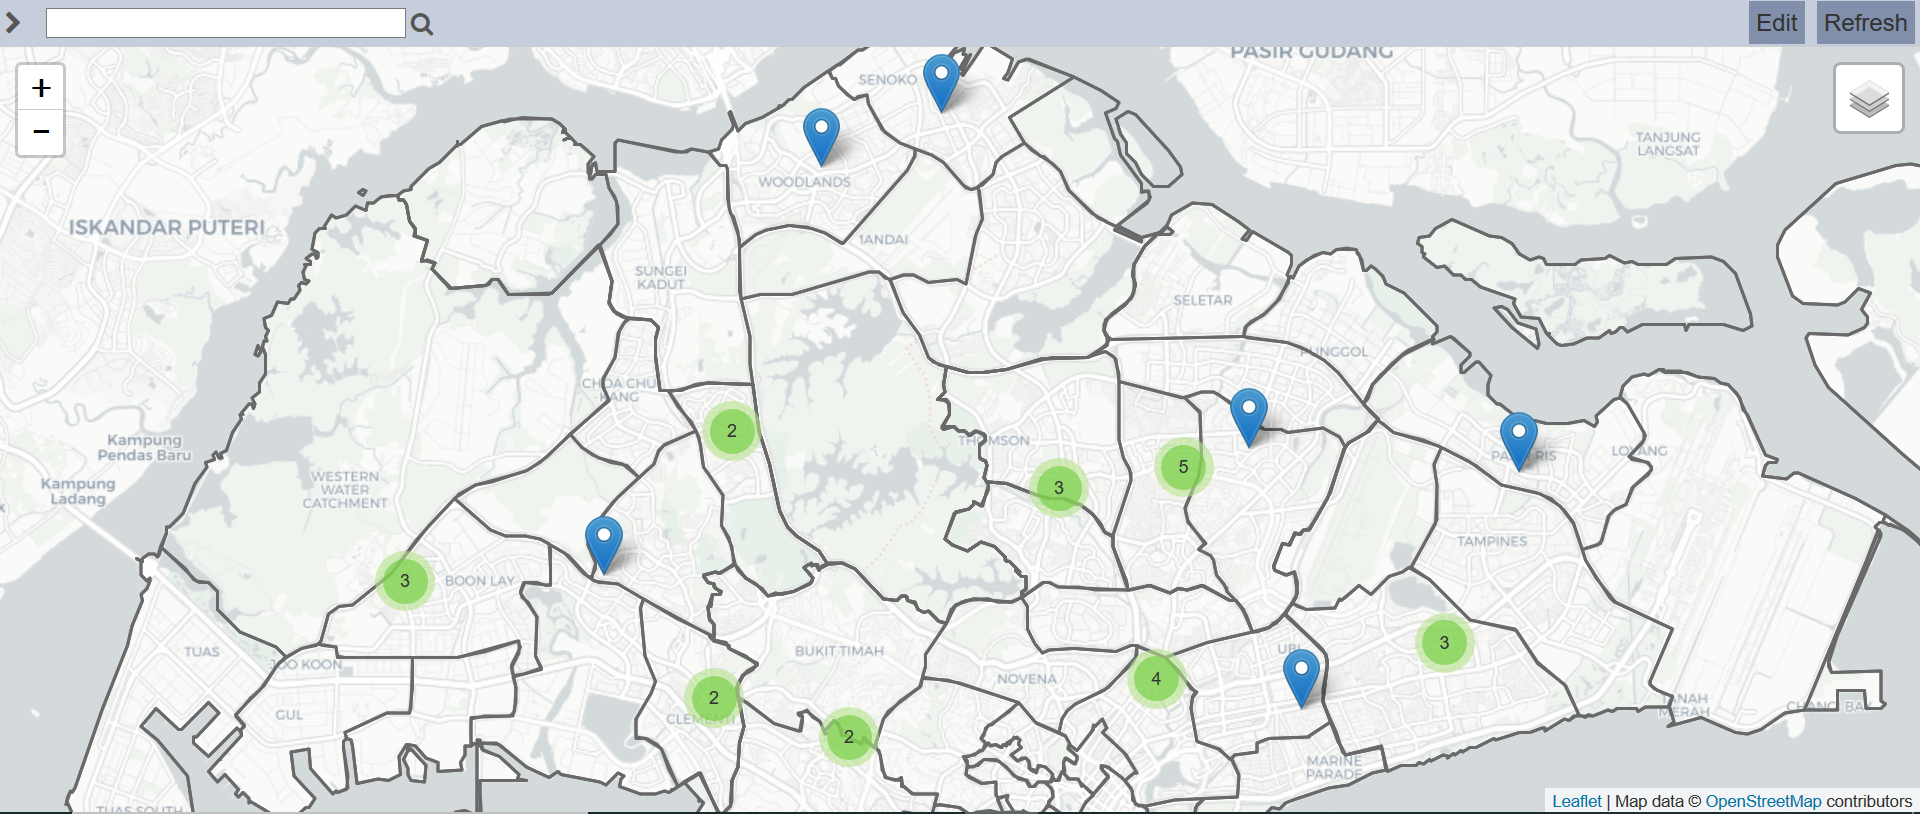
Example: Using GIS View
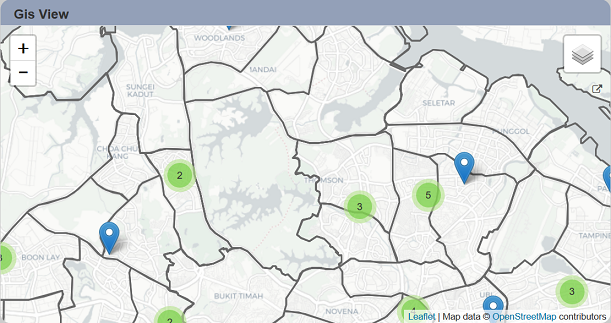
In the GIS view, you can perform the following functions.
Zoom
You can zoom in and out of the map by clicking on the “+” and “-” buttons at the upper left of the view. Alternatively, you can also use your mouse to zoom in and out.
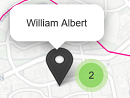
Tooltip
Depending on the settings of the GIS Explorer, when hovering over a pin, a tooltip may appear.
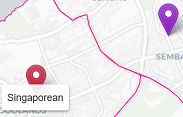
Popup
Depending on the settings of the GIS Explorer, when a pin is selected, a popup may appear.
GIS Explorer
In the GIS view, at the upper right corner, you can find the “Open GIS Explorer”  icon.
icon.
Click on the icon to launch the GIS Explorer.
Refer to GIS Explorer for more details.
Layer Control
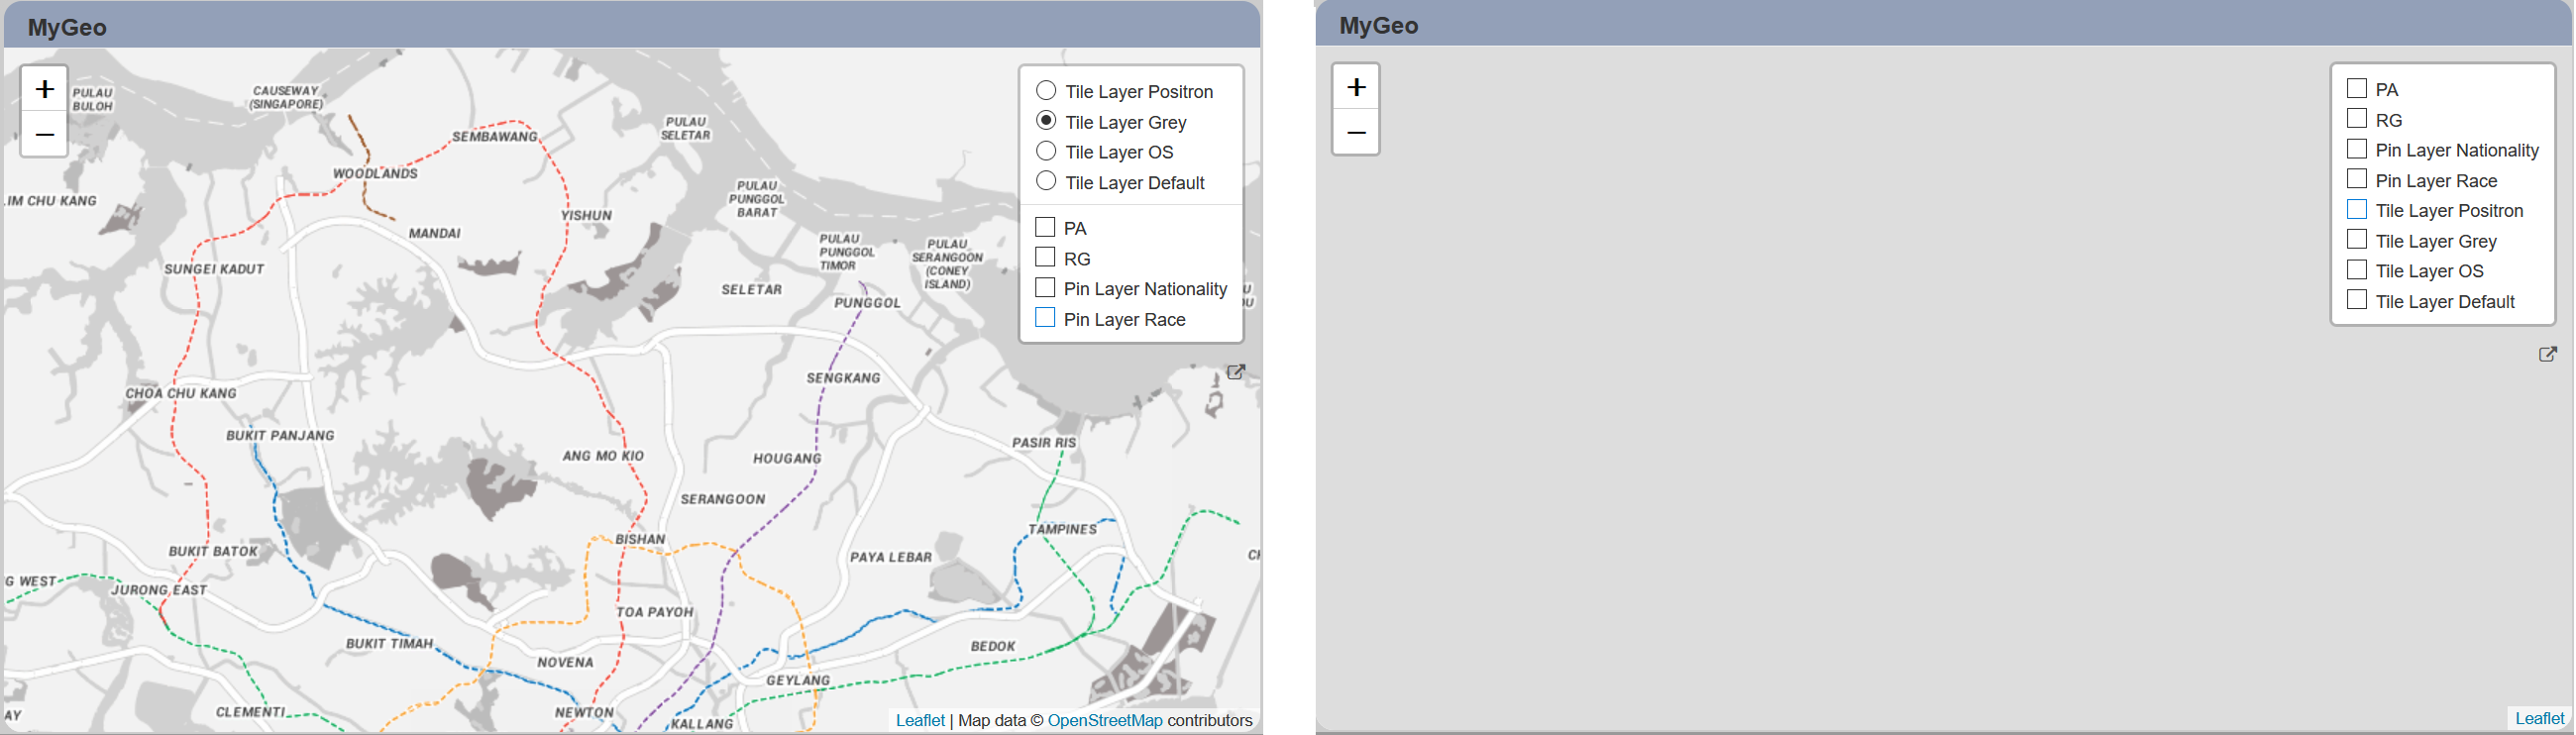
In the GIS view, at the upper right corner, you may find the “Layer Control”, either in collapsed or expanded mode.

In collapsed mode, a “Layer” icon will be displayed. To view the available layers, hover over the icon. In expanded mode, the available layers will be displayed on the map.
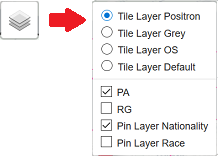
There are 3 different layers:
- Tile Layers
- Geo layers
- Pin layers
Do note that the tile layers may allow single or multiple selection depending on the settings in the GIS Explorer. In single selection mode, one tile layer is selected at any one time. In multiple selection mode, the tile layer may have more than one layer selected or turned off (none selected). Turning off all tile layer is not advisable as you will not see any map in the view. If more than one tile layer is selected, depending on the opacity of the tile layers, you may see 2 tile layers overlapping each other.
For the geo and pin layers, you may turn the layers on or off by selecting or unselecting their respective checkboxes.
By un-selecting all layers, a plain map without any pins will be displayed (see screenshot on the left). In the case where the tile layer is in multiple selection mode, a blank view will appear (see screenshot on the right).