
Row Page View
The row page view allows you to load rows of dashboard page of the same dataset into a view.
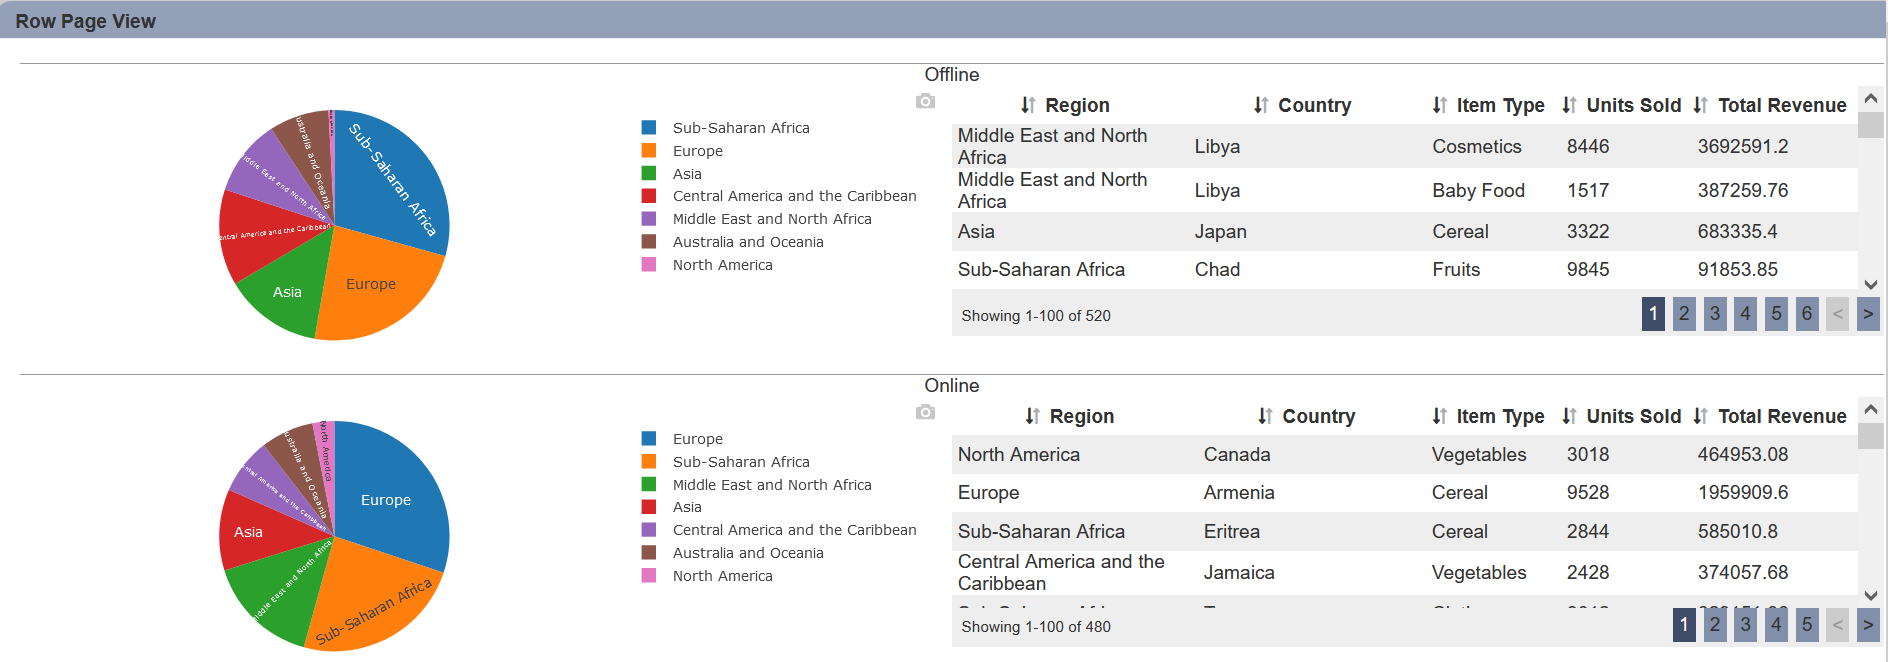
In the example above, two sets of pie chart and linear table are loaded into the view. One set for Offline and the set for Online, defined by the “Group” property.
The following is a list of the fields in the View Properties box in the dashboard designer for row page view. There are some required fields to be set for each created view.
Basic Properties
The View Properties fields vary in different charts. Below are the basic properties in the View Properties box.
| Field | Description | Mandatory |
|---|---|---|
| View Type | Type of chart, table or view. | Yes |
| Title | Name of the view. | No |
| Dataset | Data used for the chart, table or view. | Yes |
| Subset | Partial data from a dataset used for the chart, table or view. | No |
| Group | Places the output of the dataset/subset into separate groups or data traces based on field selected. | Yes |
| Page | Selects the page to load into the view. | Yes |
| Row Height | Defines the size of the view to be loaded. By default, height is set to 20. |
Yes |
Other Properties
The other property fields are available to enhance the view. Below are the other properties in the View Properties box for the row page view.
| Field | Description | Default |
|---|---|---|
| Controlled By | Links dashboard controls to the view. One or more controls can be added to affect the data displayed on the view. |
Empty |
| Label | Name of each page view. By default, it is not defined, therefore the values in the field defined in the “Group” property is used. |
Empty |
| Right Padding | Defines the right padding of the view. | 0 |
| Click to Page | Adds a link to another view. | Empty |
| Click to Page Tip | Adds a brief description of the link above. | Empty |
| Maximisable | If selected, places a maximise button on the top right of the view (when not in edit mode). This will maximise the view to fill the browser. |
Not selected |
| Margins | Allows adjusting margins and padding between charts and grid. | Default settings |
| Advanced | Add a special CSS class to your view. | Empty |