
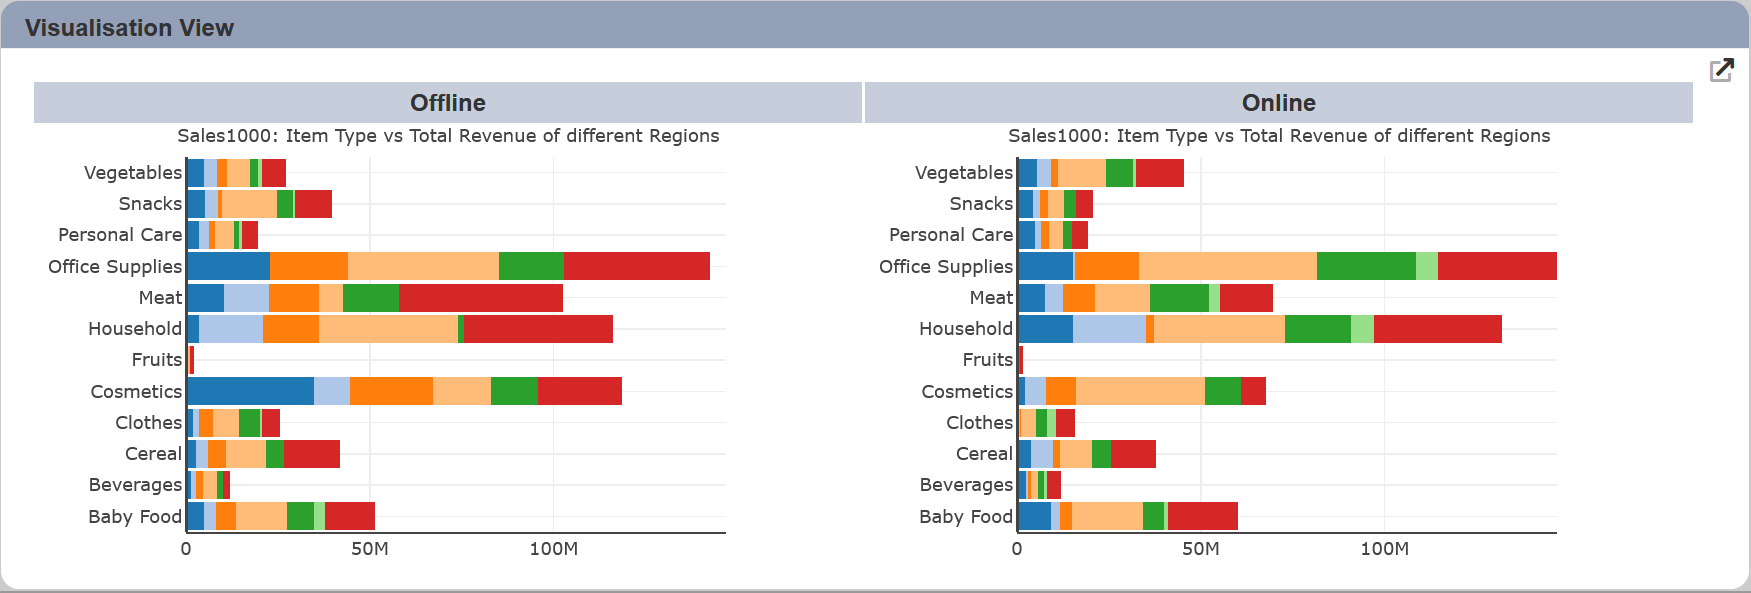
Visualisation View
The visualisation view allows you to load a subset of the visualisation features into a view.
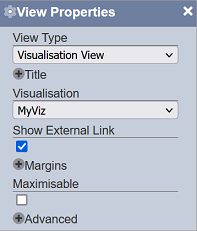
The following is a list of the fields in the View Properties box in the dashboard designer for visualisation view. There are some required fields to be set for each created view.
Basic Properties
The View Properties fields vary in different charts. Below are the basic properties in the View Properties box.
| Field | Description | Mandatory |
|---|---|---|
| View Type | Type of chart, table or view. | Yes |
| Title | Name of the view. | No |
| Visualisation | Data used for the the visualisation view. | Yes |
Other Properties
The other property fields are available to enhance the view. Below are the other properties in the View Properties box for the visualisation view.
| Field | Description | Default |
|---|---|---|
| Show External Link | If selected, display an external ink icon in the view. | Selected |
| Margins | Allows adjusting margins and padding between charts and grid. | Default settings |
| Maximisable | If selected, places a maximise button on the top right of the view (when not in edit mode). This will maximise the view to fill the browser. |
Not selected |
| Advanced | Add a special CSS class to your view. | Empty |
View Usage
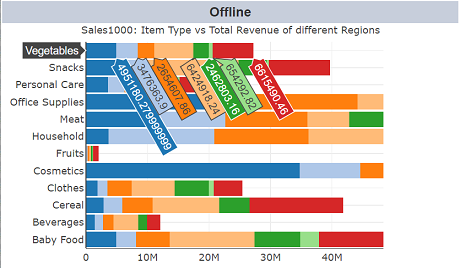
You can view the details of the visualisation by hovering over the view.
You can also launch the Visualisation Designer by clicking on the  “Open Visualisation” icon at the upper right corner of the view.

Refer to Visualisation Designer for more details.